
Gold Weekly Technical Outlook: Neutral
- Gold prices rebound off psychological support at a critical juncture that has provided a pivot point for the imminent move
- USD strength holds XAU/USD at bay - safe-haven greenback remains a prominent driver of price action
- Silver futures slip to a two-year low but prior resistance turned support caps the downward move

Gold (XAU/USD) Technical Analysis
After five months of losses, gold futures continued to slide before finding support at the $1,700 psychological level this week. From the four-hour chart, that strong bounce led to the build of a hammer formation, which led into a continued run of gains into the end of the week. As global monetary tightening and a hawkish Federal Reserve drive USD strength, the safe-haven appeal of the greenback remains a continued threat to the yellow metal.
Several key technical levels remain in-play for gold price action, and a move above $1,736 could open the door for a re-test of the 23.6% Fibonacci level of the 2008 – 2022 move at $1,756.9. A break of that level then brings $1,772 back after which psychological level resistance comes back into the picture with the $1,800 level.
Gold (XAU/USD) Futures Four-hour Chart
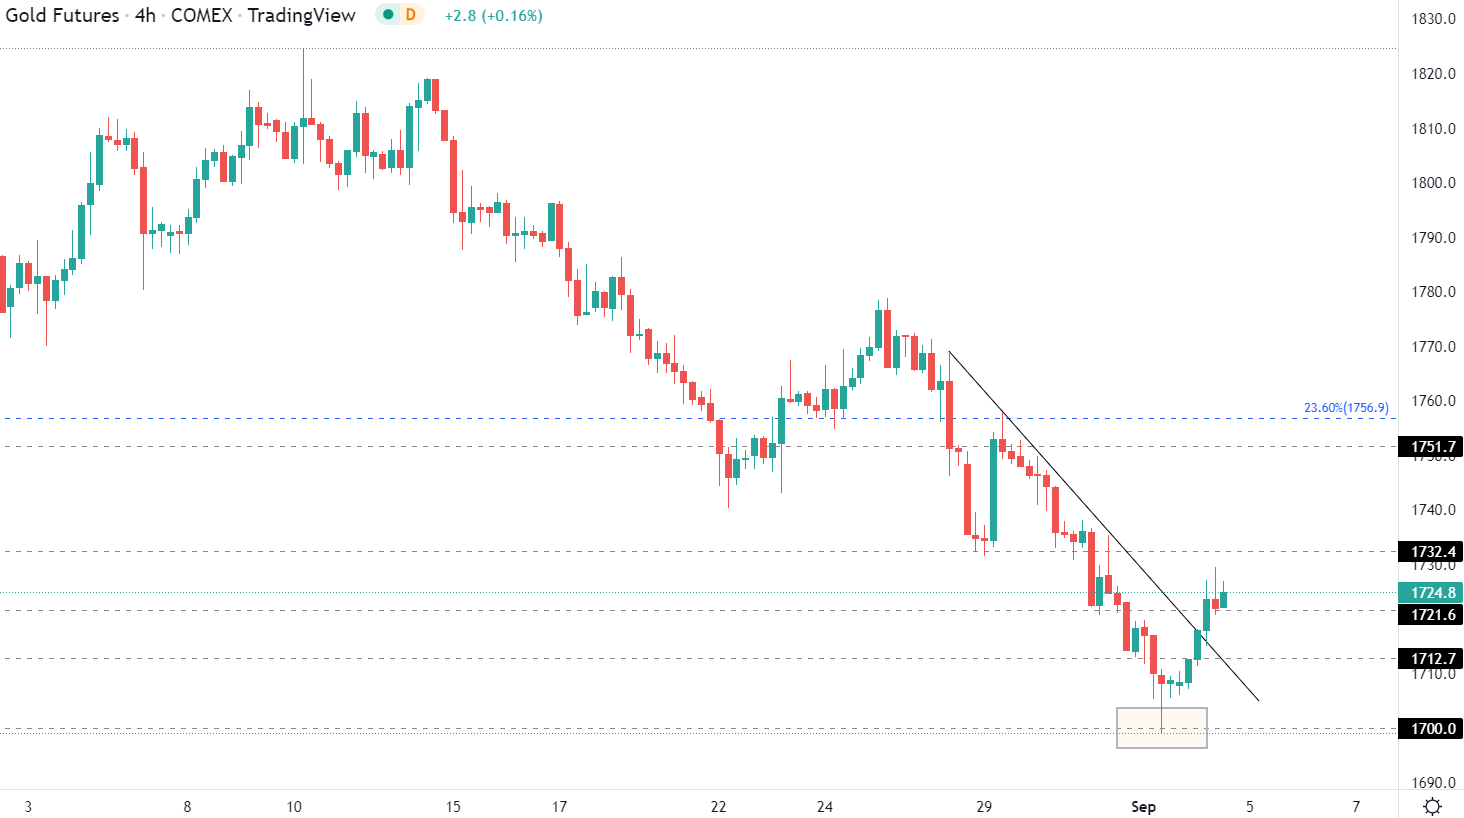
Chart prepared by Tammy Da Costa using TradingView
Bigger picture – the big question is for how much longer can bulls hold gold prices above key support? The zone that runs from 1680-1700 has been in-play multiple times over the past couple of years, ever since gold topped-out in the summer of 2020. That zone was in-play again last week as buyers responded to the $1700 psych level, but the trend has been markedly bearish since a failed run at the highs in February and the question remains as to whether bulls can stop the bleeding at the 1680-1700 level.
Gold (XAU/USD) Futures Weekly Chart

Chart prepared by James Stanley; Gold on Tradingview
Silver Futures Slide into Key Long-Term Zone
Silver prices were on a stark slide this week, continuing the sell-off that’s held since a bearish engulfing candlestick showed up on the daily chart in the middle of last month. Since then, sellers have been in-control and this week pushed prices down to a fresh two-year-low. Support eventually formed around the $17.50 psychological level which led to a bounce on Friday. But so far sellers have responded at a key Fibonacci retracement that plots at 18.18 and had previously helped set support.
This Fibonacci retracement is longer-term in origin, but it has quite a bit of interest for technical traders. Given the fact that the 50% marker helped to catch the highs in calendar years of 2020 and 2021, prices are now holding between the 76.4 and 78.6% Fibonacci retracements, which had previously helped to set resistance in late-2019 and early-2020.
Silver (XAG/USD) Futures Monthly Chart
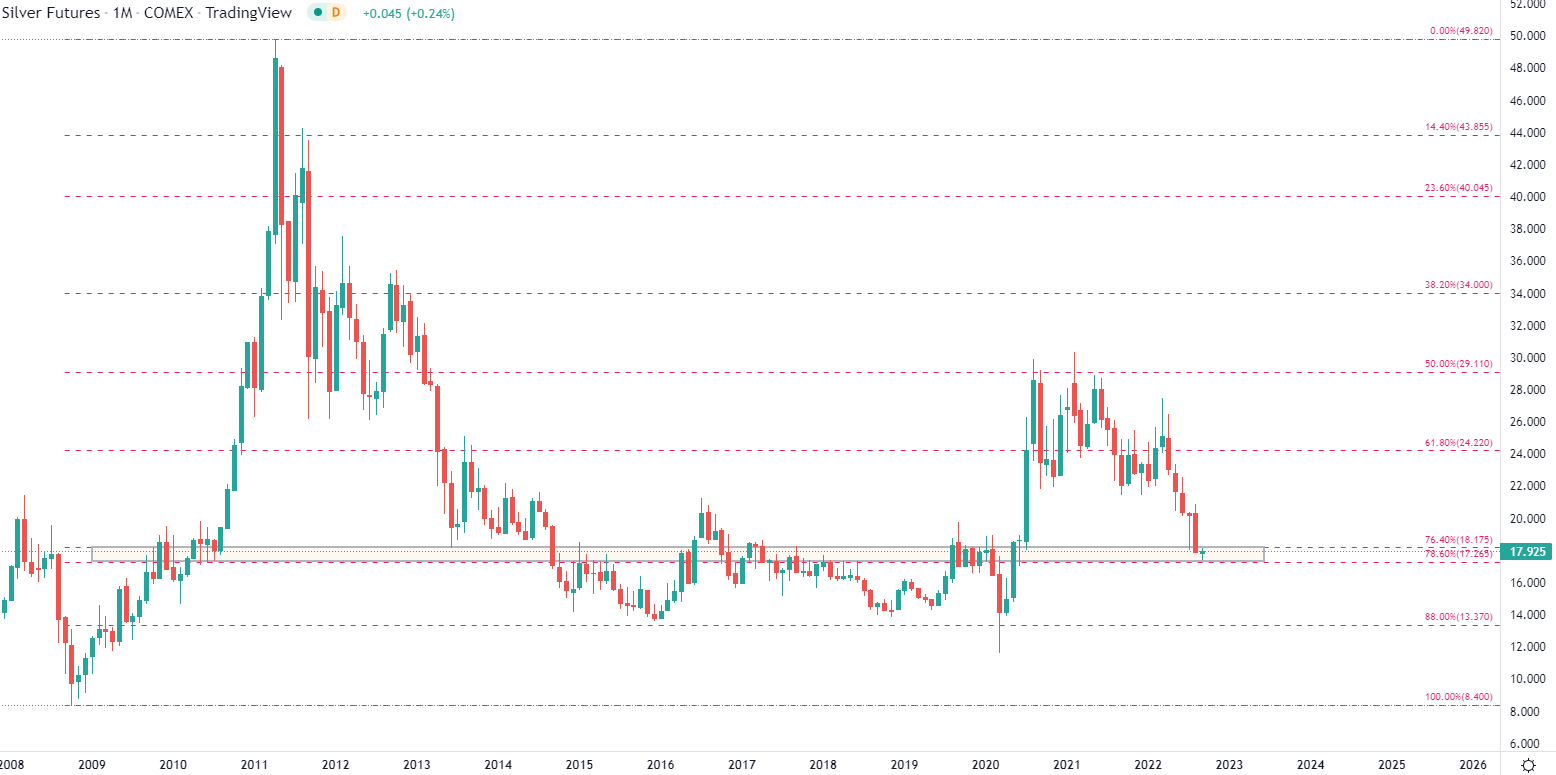
Chart prepared by Tammy Da Costa using TradingView
--- Written by Tammy Da Costa, Analyst for DailyFX.com
Contact and follow Tammy on Twitter: @Tams707