

Bitcoin (BTC) Technical Outlook: Neutral
- Bitcoin prices stabilize above key support but bulls lack direction
- BTC/USD follows equities, can bullish momentum bypass fundamental doubts?
- Psychological levels hold firm at $40,000 - $45,000 respectively
Bitcoin prices have recently been trapped within the confines of the $40,000 TO $45,000 range which has proven to provide firm levels of support and resistance for both the short and long-term move. Although the concept and adoption of digital assets remains a contentious issue, prices may continue to withstand the impact of heightened geopolitical risks, bringing key technical levels into play.
For Bitcoin (BTC), the weekly chart below illustrates how Fibonacci levels from the medium (2020 – 2021) and short-term (Feb – March 2022) move has held bulls and bears at bay despite the geopolitical backdrop. Although an array of fundamental factors continue to contribute towards volatility and demand for riskier assets over the past two-weeks, Bitcoin prices have failed to surpass the $45,000 psychological level, allowing sellers to drive prices lower.
Bitcoin Weekly Chart
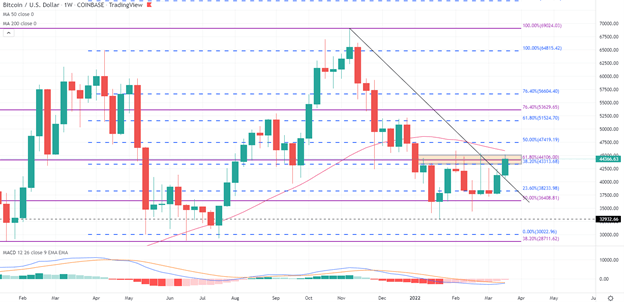
Chart prepared by Tammy Da Costa using TradingView
Bitcoin (BTC) Technical Analysis
After rising above the $40,000 handle, a level that remains as critical support, a break above trendline prior trendline resistance turned support, Bitcoin prices continued to climb, driving prices to the 61.8 Fibonacci retracement level of the 2021 move at $44,106 Fibonacci retracement level.
As buyers and sellers battle it out, the 50-week MA (moving average (MA) will likely assist in providing an additional layer of resistance at $45,868 which then leaves the door open for the 50% retracement of the April – May 2021 move at $47,419.
However, on the daily-hour chart, the capitulation of price action and the apparent support and resistance levels mentioned above could further influence the short-term move.
Bitcoin (BTC) Daily
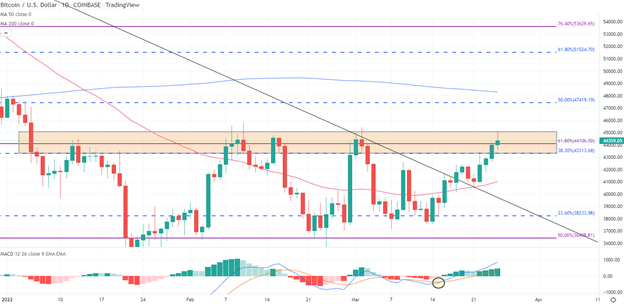
Chart prepared by Tammy Da Costa using TradingView

--- Written by Tammy Da Costa, Analyst for DailyFX.com
Contact and follow Tammy on Twitter: @Tams707