
Bitcoin and Ethereum Charts and Analysis

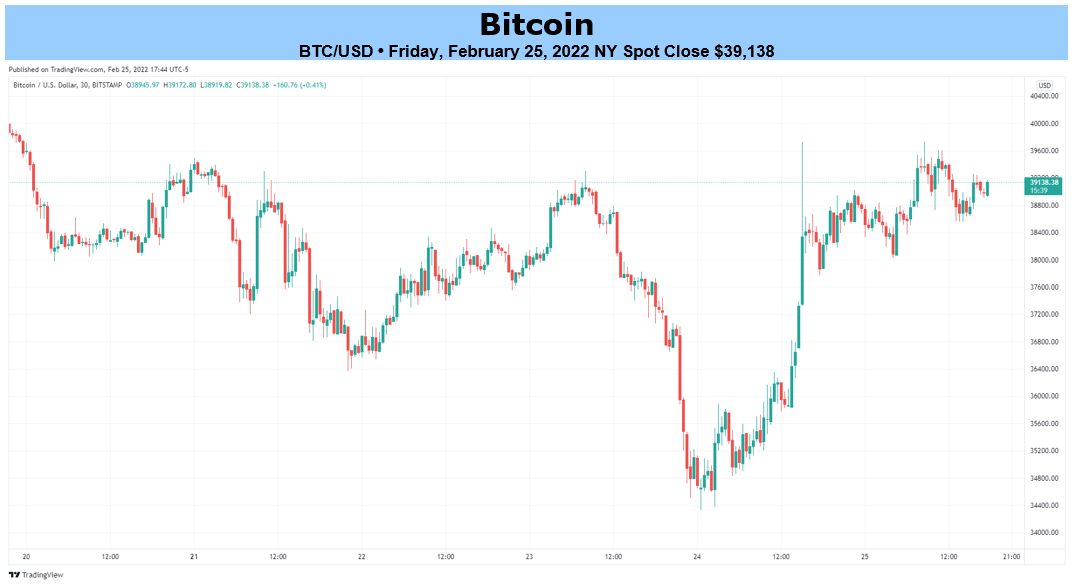
A sharp rally in Bitcoin, and a wide range of other cryptocurrency markets, has seen nearly all of this week’s sharp losses erased over the last 24 hours. The Russian invasion of Ukraine at the start of this week sent risk assets tumbling with BTCUSD making a fresh one-month low of $34,386. Thursday afternoon however saw a very sharp turnaround in a range of risk markets, leaving Bitcoin just a few hundred dollars below last Friday’s levels. This move now sees Bitcoin just below an important level of prior resistance at $39.6k which has held this week. Whether the current positive mood will continue and can help BTC break and close above this level over the coming days is important and will go a long way in determining the direction of the largest crypto by market capitalization.
Bitcoin Daily Price Chart
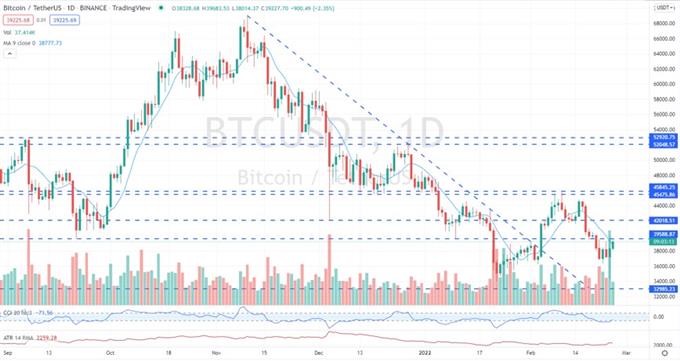
Chart via TradingView
The Ethereum chart is currently mirroring Bitcoin’s daily chart, with another sharp reversal seen on Thursday nearly fully recovered. As with the Bitcoin chart, there are obstacles ahead for Ethereum if it is to try and recover some of its past highs. The late-September low at $2,656 has been broken today and if this now turns supportive, then $2,933 becomes the next level of resistance and target.
Ethereum Daily Price Chart
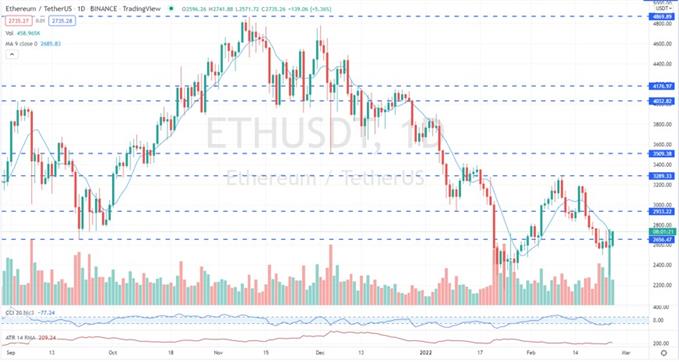
Chart via TradingView
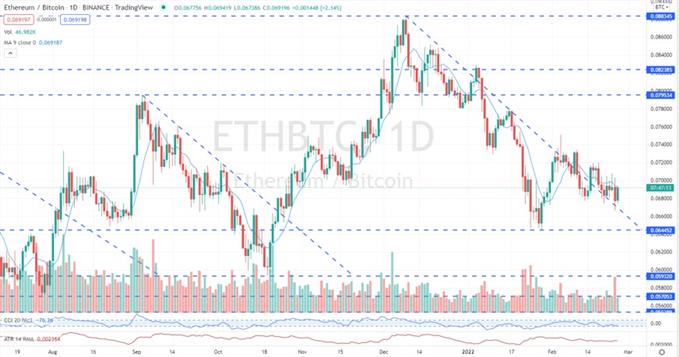
One chart that I follow closely, which sometimes gives a clue to the future direction of the altcoin market, is the Ethereum/Bitcoin spread. If the spread moves higher then it normally follows that the altcoin market is in for a period of outperformance and vice versa when the spread falls. The spread has been falling over the last few weeks and is keeping itself aligned with the downtrend. This downtrend has been broken over the last couple of weeks which normally suggests a period of higher prices, but this has not happened yet. A break above 0.7200 should allow the spread to move even higher if it occurs.
Ethereum/Bitcoin Daily Price Chart
What is your view on Bitcoin and Ethereum – bullish or bearish?? You can let us know via the form at the end of this piece or you can contact the author via Twitter @nickcawley1.