
S&P 500, FTSE 100 Analysis and News
S&P 500 | Beware of the Mid-Month Pullback
A marginally softer week for the S&P 500 which continues to hover around the 4500 level. The index looks to close out the week on the front foot, subsequently breaking the streak of four consecutive session of declines in the S&P 500, which had increased market participants speculating about a possible correction. Although despite the recent speculation, the index is only 0.9% off the all-time high.
Looking ahead to next week, perhaps the main focus will be the monthly option expiry given a recent pattern has emerged throughout the year, in which the S&P 500 experiences a pullback heading into the third Friday of the month as the chart below highlights. On the economic calendar, US CPI will garner attention and with growth having peaked, elevated consumer prices will no doubt ring the stagflation bells, although as ISM Mfg. and Non-Mfg. prices paid data slips, risks are tilted to the downside.
In terms of levels to watch out for, arguably the line in the sand for pullbacks is the 50DMA, which has consistently seen dip-buyers enter the fray.
Another Round of Mid-Month Selling for the S&P 500?
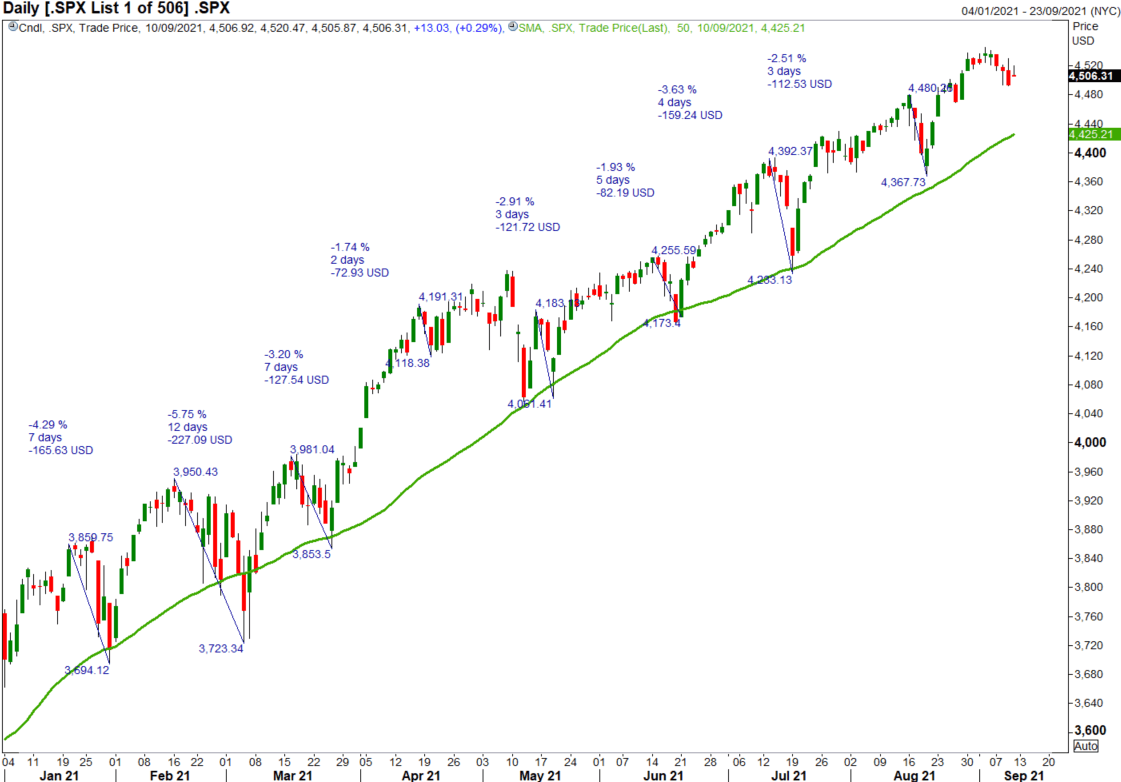
Source: Refinitiv
| Change in | Longs | Shorts | OI |
| Daily | -3% | -2% | -2% |
| Weekly | -4% | -5% | -4% |
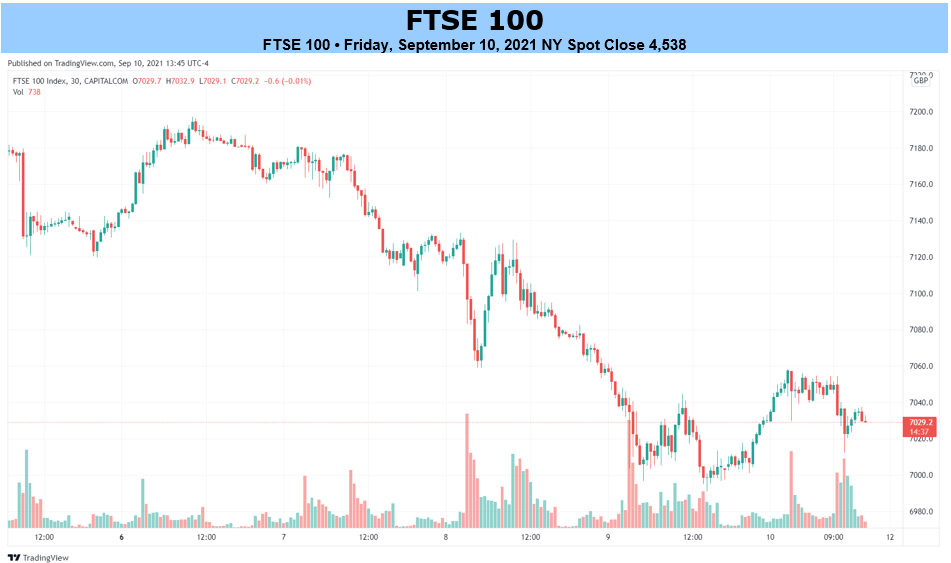
FTSE 100 | Risks Geared to a Break of 7000
Once again the FTSE 100 trades within the well defined 7000-7200 range and perhaps sums up this market at present regarding how fickle it can be. This also provides a reminder not to get married to a view and stay agile. That said, there looks to be little interest to really take the FTSE above 7200 and thus I see risks more geared to the downside with the psychological 7000 level to give way. Firstly, the UK government is embarking on a fiscal tightening path following the latest decision to hike national insurance contributions. While the BoE have slightly stoked up rate hike speculation after Bailey stated the committee had been split on the conditions for a rate hike being met.
FTSE 100 Price Chart: Daily Time Frame
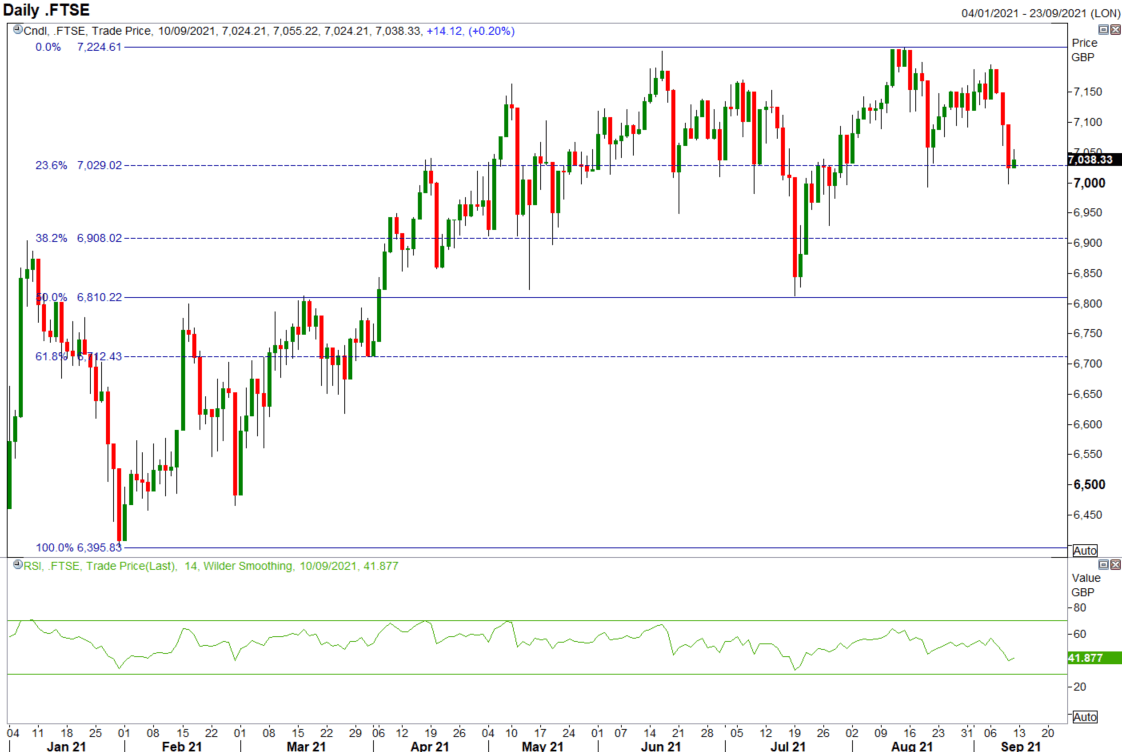
Source: Refinitiv
| Change in | Longs | Shorts | OI |
| Daily | -7% | -10% | -9% |
| Weekly | -25% | 40% | 18% |
RESOURCES FOR TRADERS
Whether you are a new or experienced trader, we have several resources available to help you; indicator for tracking trader sentiment, quarterly trading forecasts, analytical and educational webinars held daily, trading guides to help you improve trading performance, and one specifically for those who are new to forex.