
Bitcoin (BTC/USD), Ethereum (ETH/USD), Alt-Coins Price, Chart, and Analysis
- Bitcoin testing multi-month resistance.
- Ethereum continues to respect channel boundaries.
- Alt-coins rally continues unabated.

Another positive week in the cryptocurrency space with prices continuing to move higher and back towards multi-week and multi-month highs. Compared to levels seen 7 days ago, Bitcoin and Ethereum are +14% and +16% respectively while the alt-coin market has seen even greater gains. The drop-off in liquidity over the weekend can lead to outsized moves, one way or another, so traders should treat price action over the next 48 hours with care.
Cardano (ADA) Pumps Ahead of Smart Contract Announcement, Messi in The Money
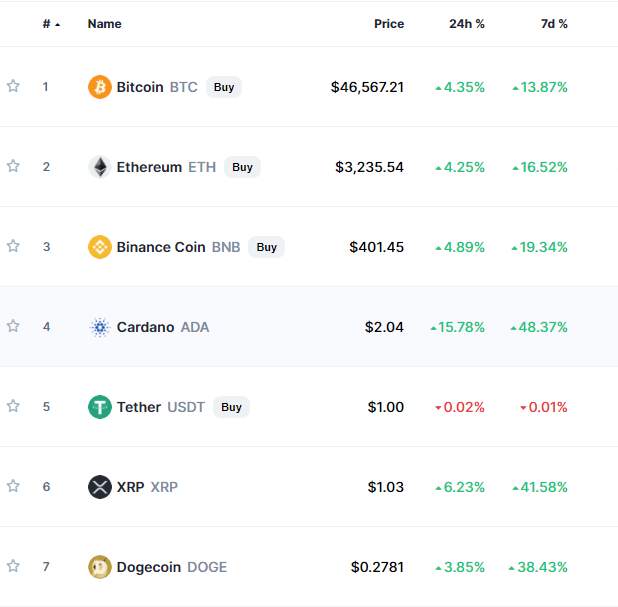
Prices via CoinMarketCap.
As mentioned earlier this week, a bullish pennant formation is playing out on the daily Ethereum/Bitcoin spread chart. A confirmed break higher – Ethereum outperforming Bitcoin – will likely add further to the alt-coin rally and bring into play 733 and 775 on the ETH/BTC spread.
Pennant Patterns: Trading Bearish and Bullish Patterns
Ethereum/Bitcoin Daily Spread (November 2020 – August 13, 2021)
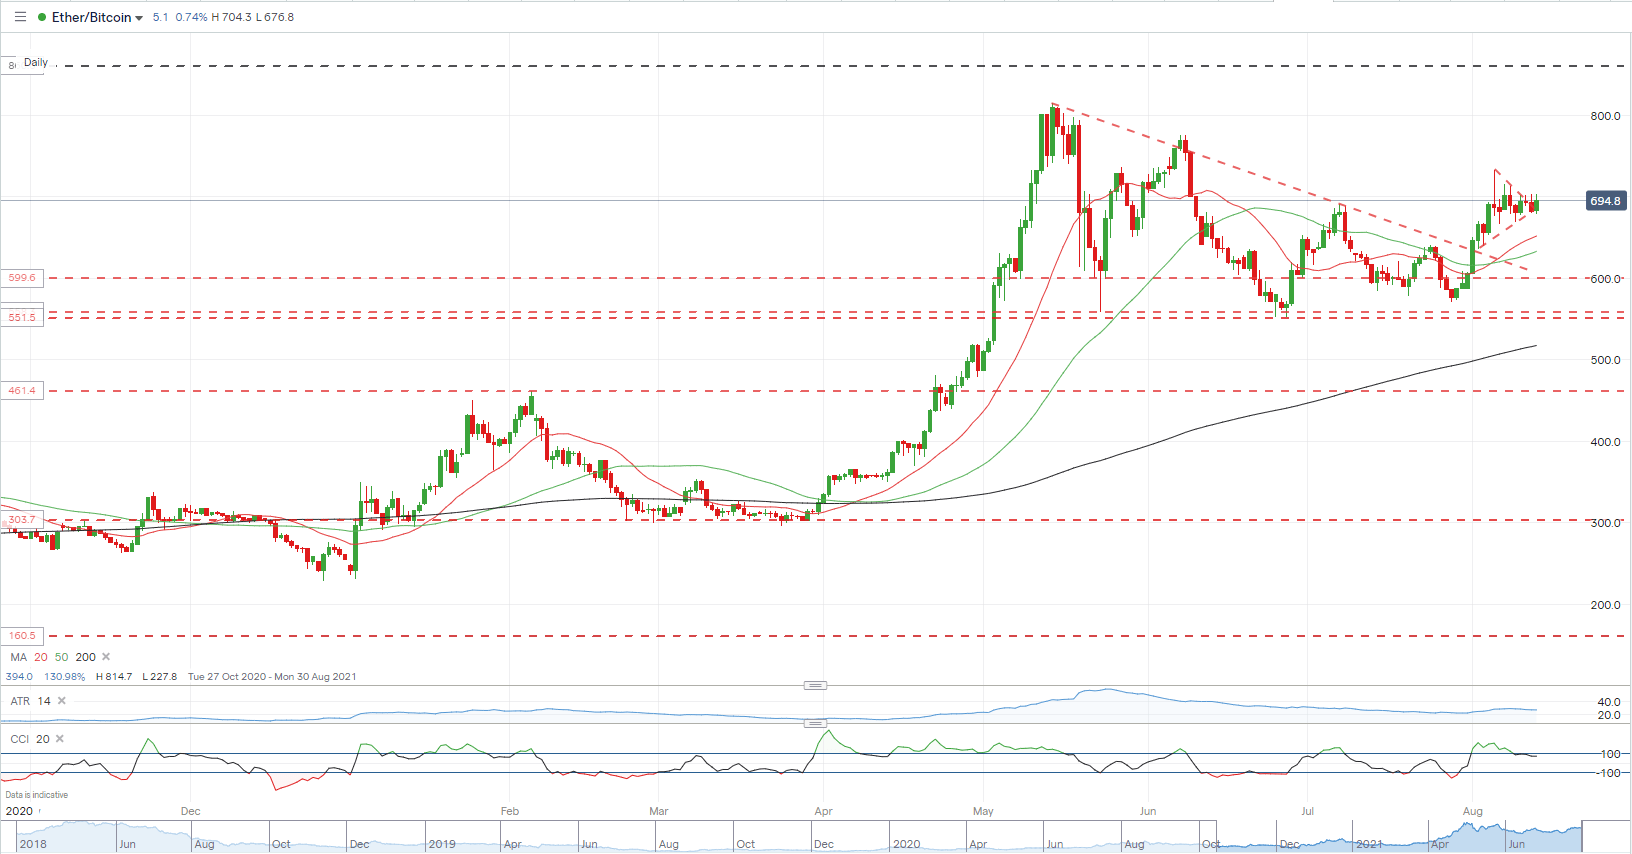
Chart via @IG.com
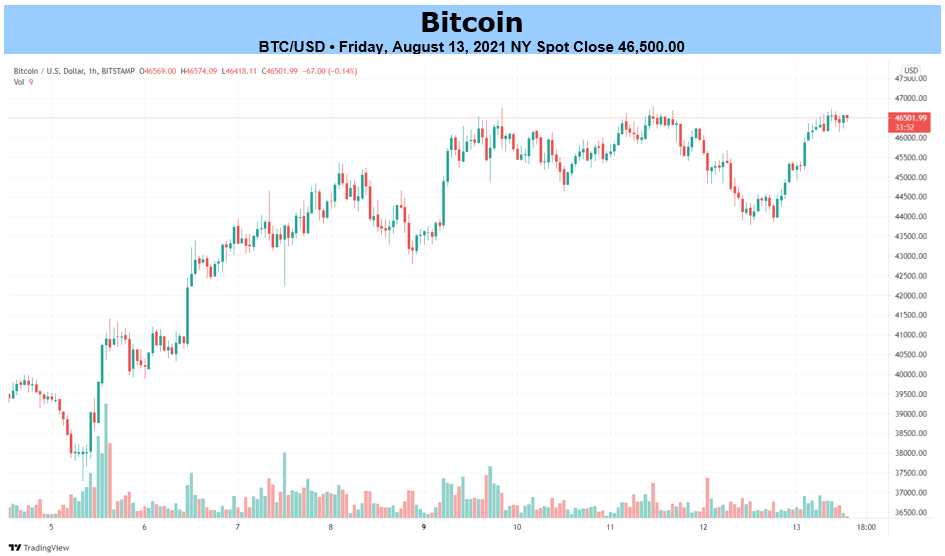
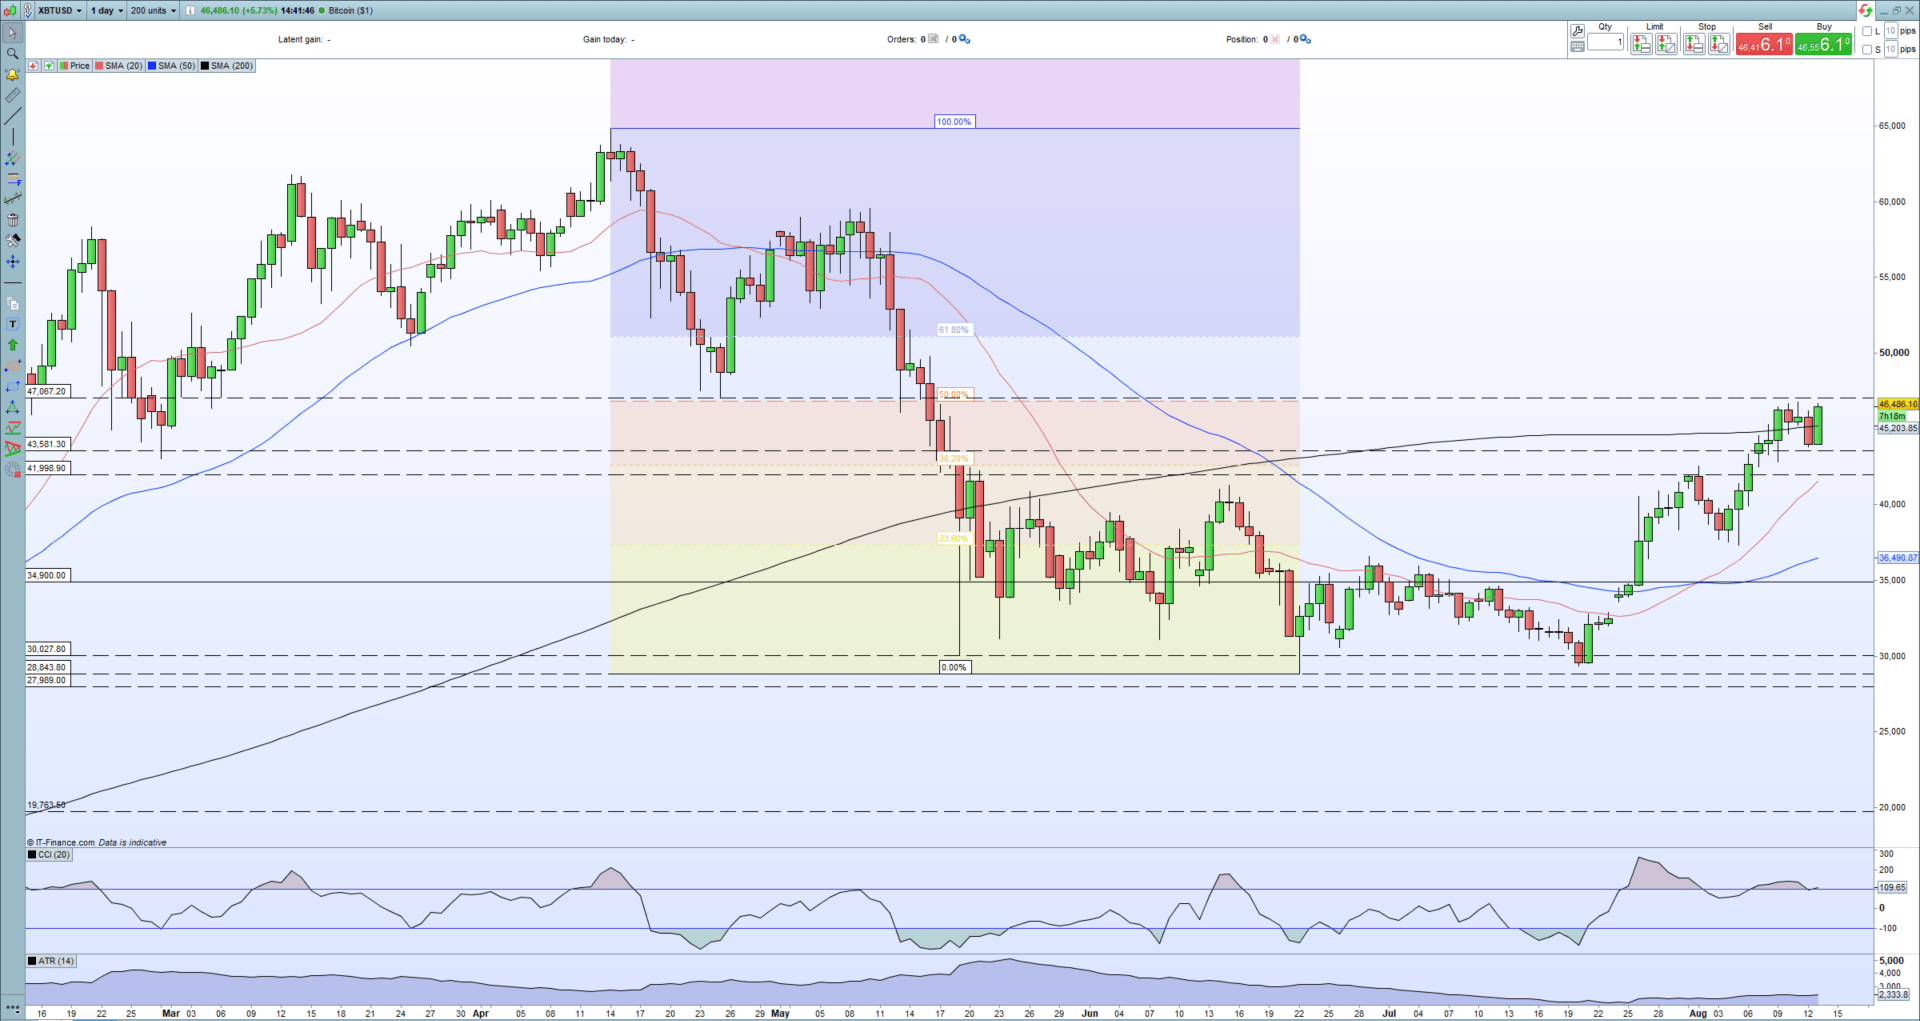
Bitcoin is printing another positive week, its 4th in a row, but is finding resistance between $46,500 and $46,800 hard to break at the moment. This resistance level is given added credibility due to the 50% Fibonacci retracement level of the mid-April/late-June sell-off positioned at $46,800. Bitcoin is also finding it difficult to make a clean break and open above the 200-day simple moving average. If Bitcoin can take out these two technical indicators, then the rally should get fresh momentum back towards $50,000.
Trend Trading with Moving Averages
Bitcoin Daily Price Chart (February – August 13, 2021)
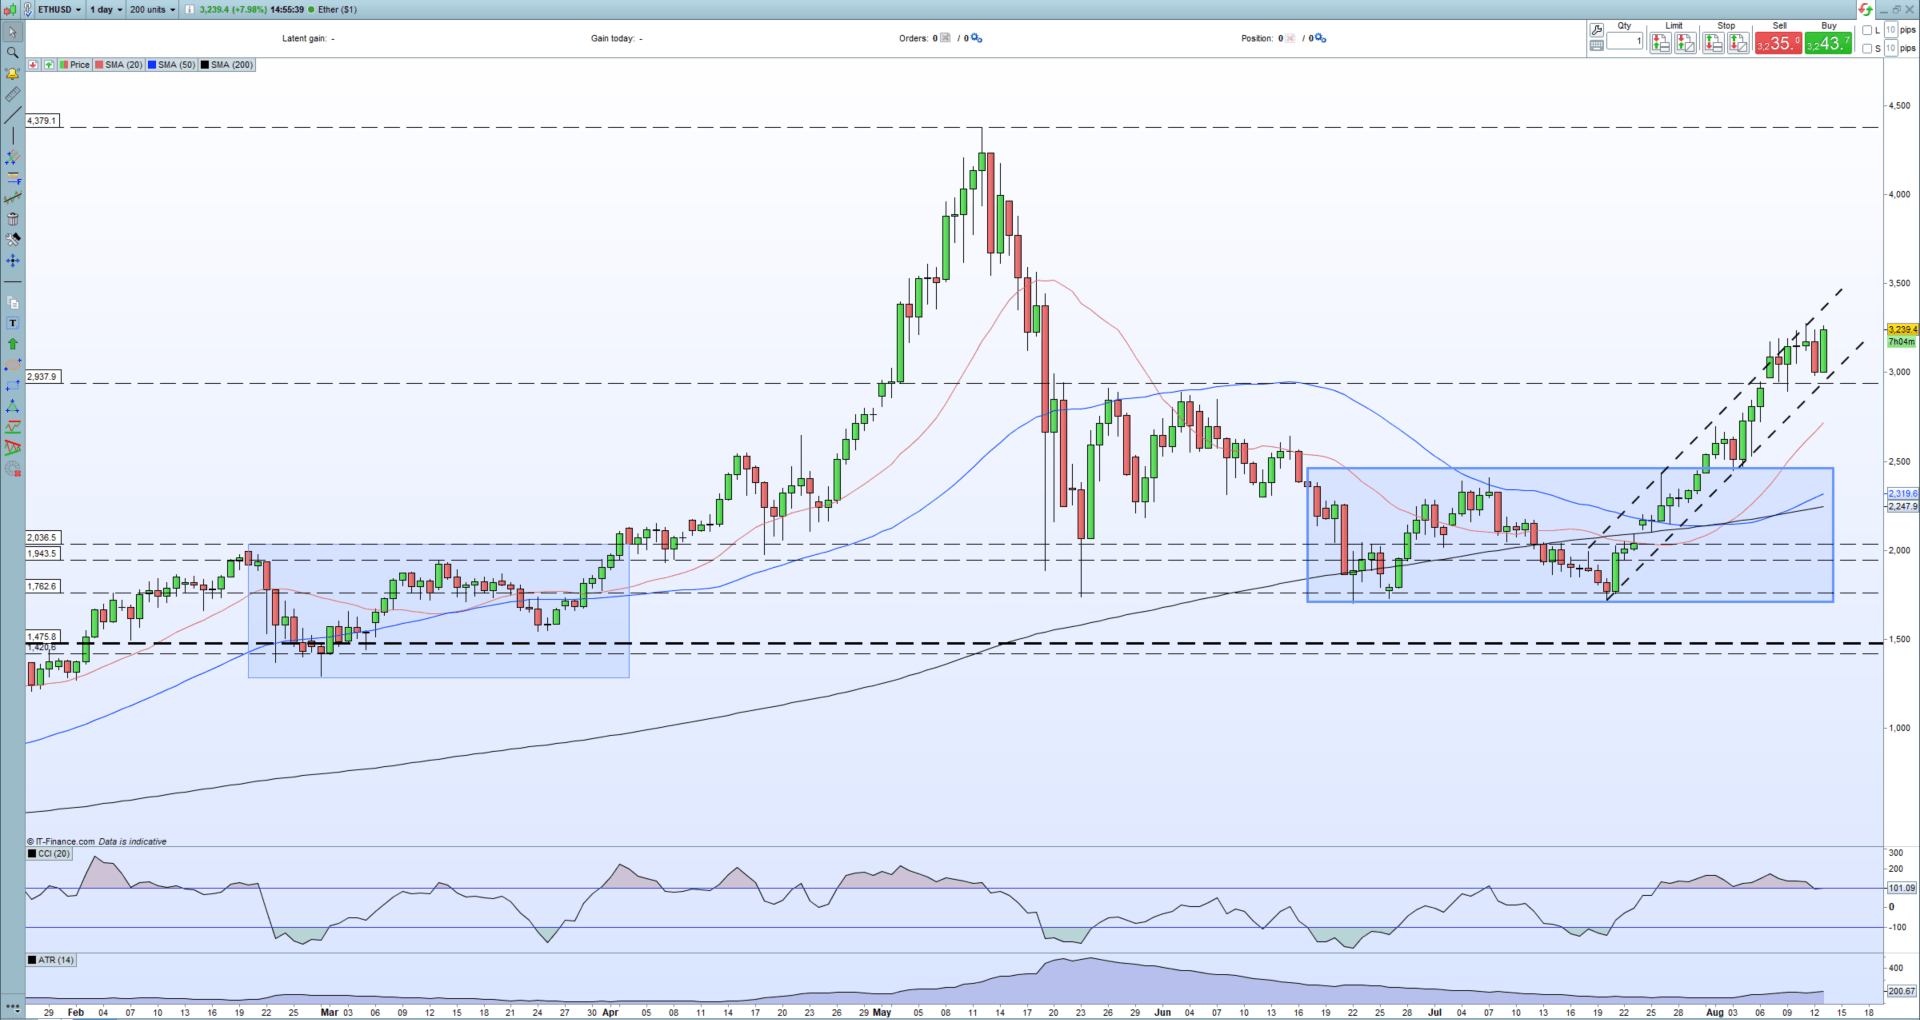
Ethereum continues to respect channel support and resistance as it nears levels last seen three months ago. The Ethereum chart is slightly more positive than the Bitcoin chart with the spot price above all three simple moving averages, which are in a positive order, and is aided by a bullish ‘golden cross’ made at the start of the week. If Ethereum continues to stay within the uptrend, then due to the angle of the channel, Ethereum looks likely to break above the current cluster of highs.
Ethereum Daily Price Chart (December 2020 – August 13, 2021)

What is your view on Bitcoin and Ethereum – bullish or bearish?? You can let us know via the form at the end of this piece or you can contact the author via Twitter @nickcawley1.