

Source: IG Charts
Main USD/MXN Talking Points:
- Mexico suffers worst economic contraction in history
- Dollar weakness continues
- USD/MXN limited by downward resistance
USD/MXN continues in somewhat of a choppy price action, not quite finding a stable direction, resembling what is happening around the world right now.
The increase in new cases of coronavirus has taken its toll on the Mexican peso, which, along with other emerging currencies, is highly linked to economic growth. While the dollar has had a tough few weeks, even having its role as the world's reserve currency questioned, the U.S. currency is still the place many investors turn to when faced with an uncertain outlook.
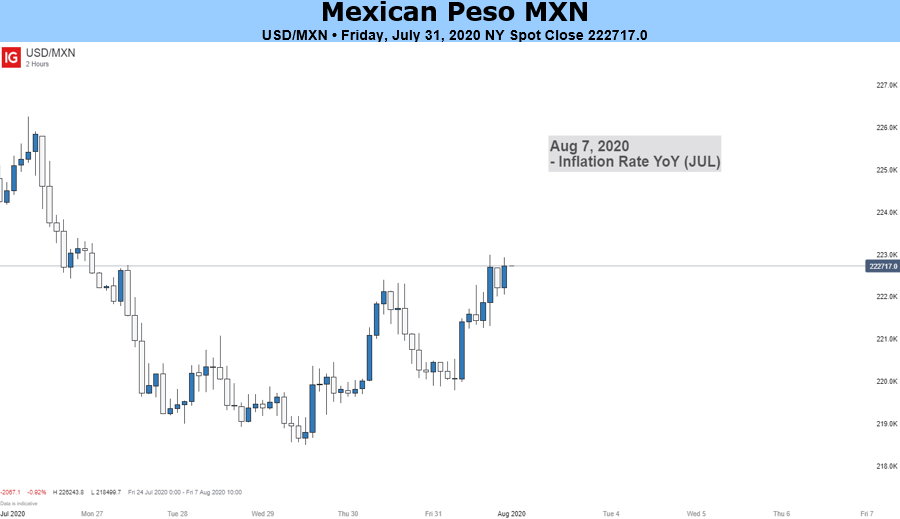
This weakness has caused the USD/MXN to retreat from its late June peak, dropping from 23.20 to 21.85 in Wednesday's session. But again it seems that things have turned against the peso, after Mexico suffered its worst economic contraction in history.
The Gross Domestic Product (GDP) of Mexico recorded a contraction of 18.9% in the second quarter of the year over the same period last year, which is the worst reading of the data in history in the context of the coronavirus pandemic.
Adding even more bullish support for USD/MXN, the US data also raises concerns, especially after the Federal Reserve acknowledged that the future of the economy remains very uncertain, with the economy still going through a very dark period while waiting for progress on the virus.
Looking ahead, risk-sentiment is likely to continue to be the main driver for USD/MXN, as coronavirus cases continue to grow in the United States and Latin América. Dollar weakness is likely to subside somewhat as investors continue to look for safer returns, although it is still far from being in a good position.
USD/MXN 4-hour chart (22 May – 31 July 2020)
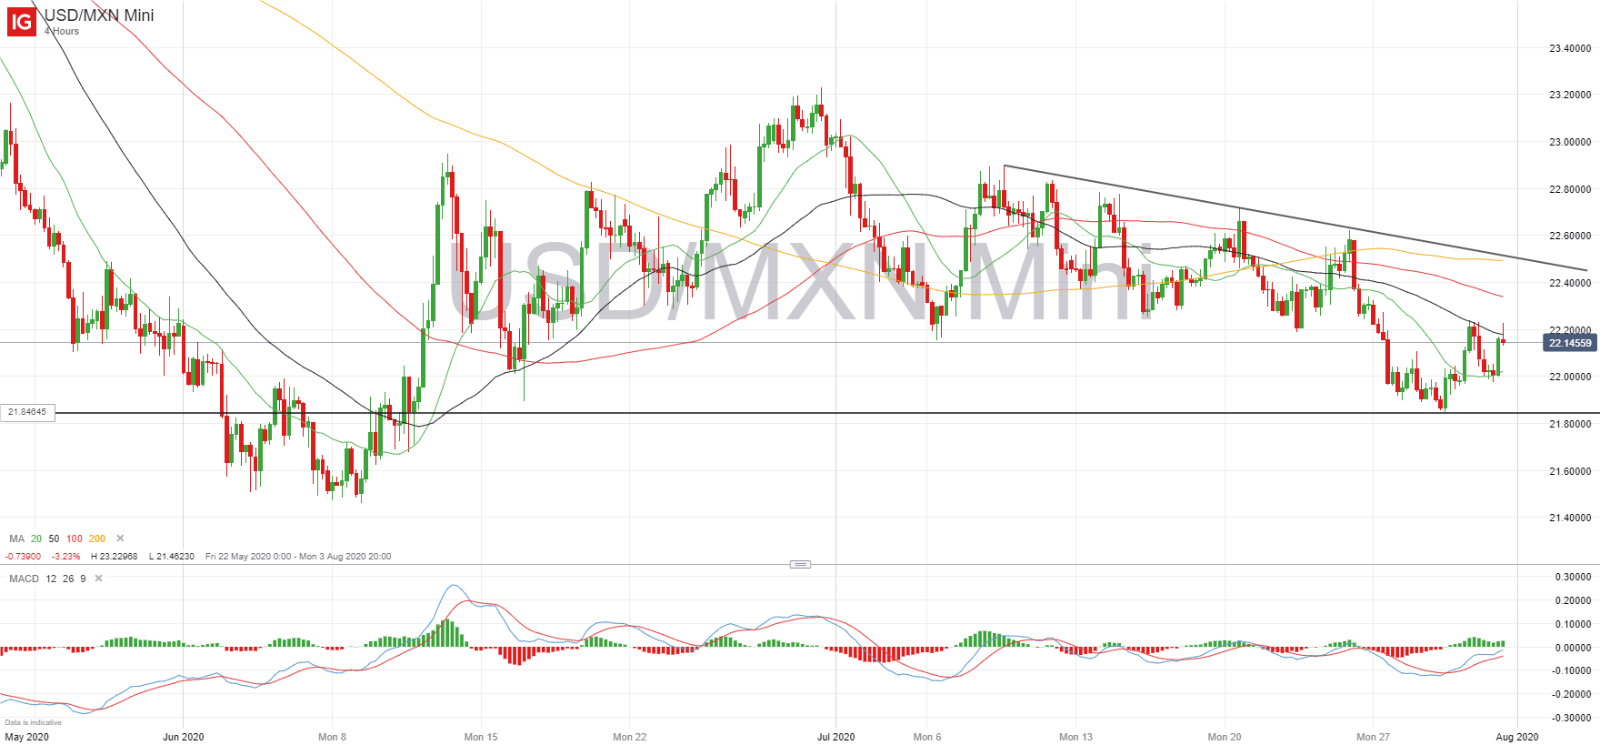
From a technical standpoint, the pair continues to trend lower, but seems to be losing seller support. On the 4-hour chart we see how the USD/MXN has created a line of downward resistance since July 8, which we could see continuing to support further declines if lower highs are sustained. So far the pair has found some resistance at the 50-period moving average, halting advances at 22.22, close to the 50% Fibonacci retracement level that has been in play for some time.
The risk now is whether USD/MXN will be able to break out of the 21.80 support level or will it act again to stop the declines. On the upside, a push above 22.23 could lead to another attempt to break the downward resistance line, now at 22.50, which could be possible if the dollar amasses more buying support in the coming days.
--- Written by Daniela Sabin Hathorn, Market Analyst
Follow Daniela on Twitter @HathornSabin