
S&P 500, DAX 30, FTSE 100 Analysis and News

Source: DailyFX
S&P 500 | Irrational Exuberance Faces a Reality Check
In a week that saw bankrupt companies spiking to pre-COVID 19 levels, and an unrelenting bid in tech stocks that saw a new record high despite the economic uncertainty, the term ‘irrational exuberance’ coined by former Fed Chair Alan Greenspan springs to mind. However, this exuberance faced a reality check amid Thursday’s sell-off in which the global equities posted their largest one day drop since mid-March. As we closed out the week, the equity market has posted a modest bounce back, which isn’t unusual following a 5% drop. That said,Thursday’s session will provide a stark reminder to market participants that downside risks remain, particularly as second wave concerns mount. As we look to next week, eyes will on Fed Chair Powell’s Testimony (Tues 16th).
| Change in | Longs | Shorts | OI |
| Daily | 5% | -3% | 1% |
| Weekly | 21% | -19% | -2% |
S&P 500 Price Chart: Daily Time Frame

Source: IG Charts
FTSE 100 | BoE to Top Up QE
Brexit is once again on the agenda with high-level talks scheduled between UK PM Johnson and EC President Von Der Leyen on June 15th. Given that the UK have reiterated that they do not plan on asking for a transition period extension before the July 1st deadline, no deal fears will continue to pick up in the run-up to October 31st, in the absence of notable progress. Elsewhere, the BoE is expected to increase its asset purchase facility by £100bln, however, risks are skewed towards more QE purchases.
| Change in | Longs | Shorts | OI |
| Daily | 24% | -1% | 3% |
| Weekly | -46% | 57% | 14% |
FTSE 100 Price Chart: Daily Time Frame
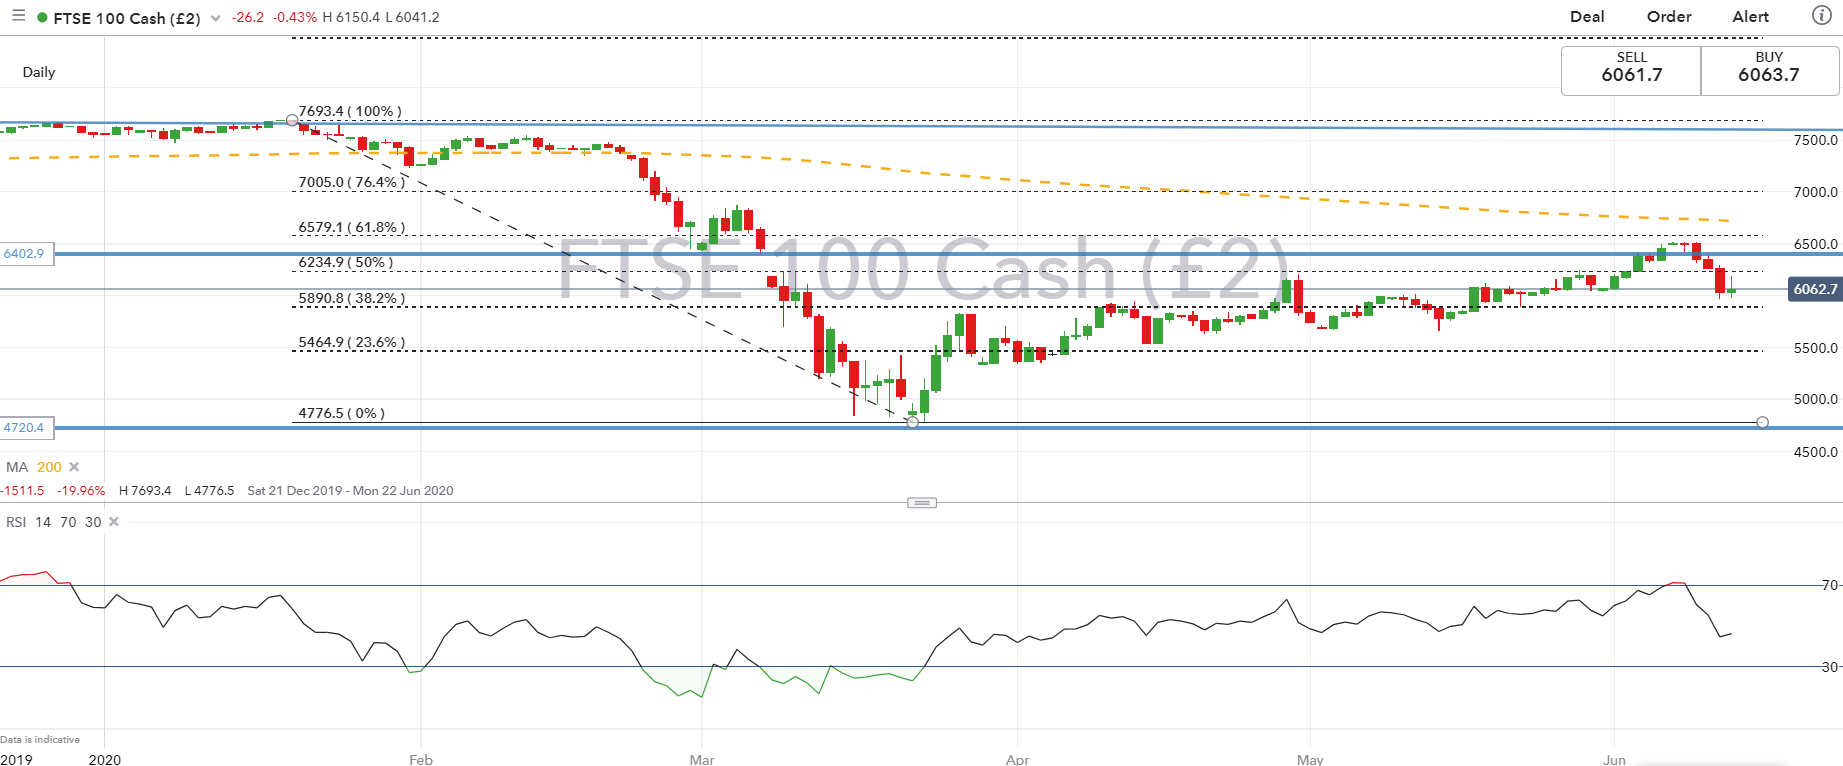
Source: IG Charts
RESOURCES FOR TRADERS
Whether you are a new or experienced trader, we have several resources available to help you; indicator for tracking trader sentiment, quarterly trading forecasts, analytical and educational webinars held daily, trading guides to help you improve trading performance, and one specifically for those who are new to forex.
--- Written by Justin McQueen, Market Analyst
Follow Justin on Twitter @JMcQueenFX