Chart created with TradingView
Gold Fundamental Forecast: Neutral
- Gold prices drive higher as global economic growth prospects dim
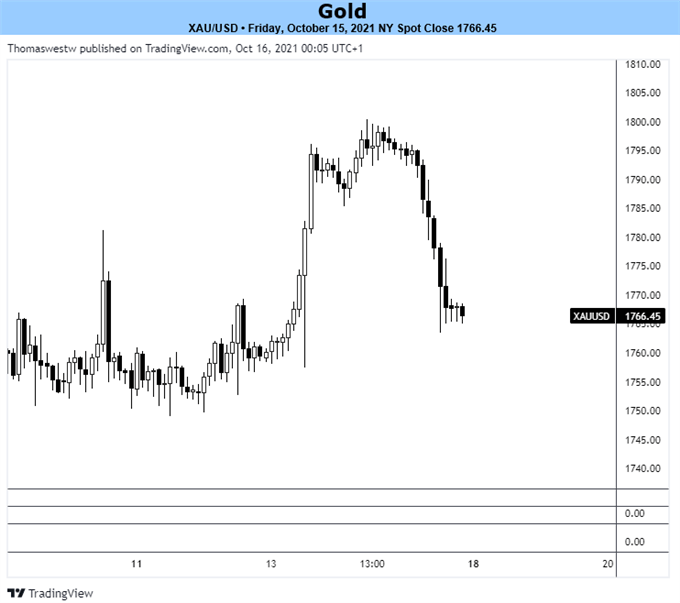
- XAU/USD surrenders a portion of gains after retail sales impress
- Chinese third-quarter GDP in focus to gauge global economic recovery


Gold fell on Friday, but prices managed to close the week out with a gain just north of half a percent against softer Treasury yields and a weaker US Dollar. A better-than-expected US retail sales figure for September pressured bullion Friday. The month-over-month figure crossed the wires at 0.7% versus the Bloomberg consensus forecast of -0.2%. That helped underpin Treasury yields, which slowed gold’s advance.
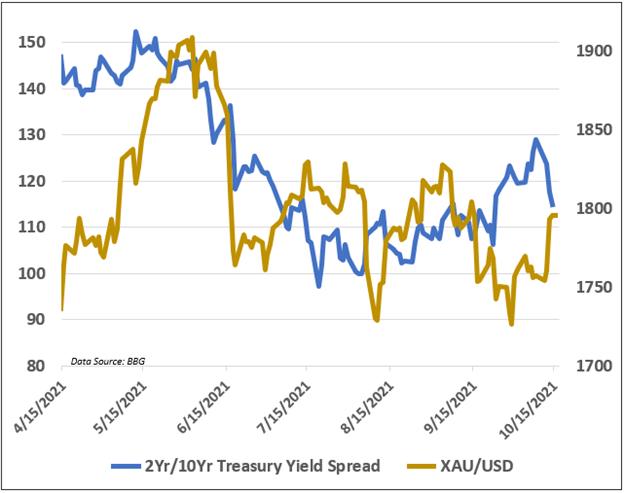
The Federal Reserve’s FOMC minutes and inflation data stoked concerns over the economic recovery last week. The Treasury curve flattened across closely watched yield spreads last week. A flattening of the curve occurs when spreads between long- and short-dated Treasury yields tighten. The spread between the two- and 10-year Treasury notes are often used as a barometer for the economy’s outlook. That measure hit the lowest since September 22 last week.
Growing pessimism over the economic recovery caused the Treasury market repricing, with rising inflation posing the primary risk. Sky-high energy prices appear to be one of the biggest inflationary drivers, with natural gas, coal, and crude oil prices all surging. Those rising energy prices threaten the Fed’s transitory inflation narrative.
Gold is thought of by some as an inflation hedge, although there is little evidence bullion serves to counter inflation as an asset-specific hedge. Instead, gold’s rise is being ushered by the retraction in economic bets, which the yield curve reflects. A drop in Treasury yields bolsters the yellow metal’s appeal being a non-interest-bearing asset.
That said, keeping an eye on yield spreads may be key to gauging where gold heads next. Moreover, high-impact economic events will likely be key to the outlook. With that in mind, this week will bring Chinese third-quarter GDP, with analysts expecting a 5.2% figure to cross the wires, according to a Bloomberg survey. A better-than-expected print may reinvigorate bullish bets over the global economic recovery. That could drag gold prices lower.

--- Written by Thomas Westwater, Analyst for DailyFX.com
To contact Thomas, use the comments section below or @FxWestwater on Twitter


