
GOLD FUNDAMENTAL HIGHLIGHTS:
- Gold Consolidating as Fed Remains Dovish
- Potential US Dollar Turning Point Presents a Risk to Gold
- Key US Data in Focus: NFP and ISM PMIs
Gold Consolidating as Fed Remains Dovish
Gold prices have risen for a 2nd consecutive week signalling that the precious metal is attempting to form a base. The Federal Reserve showed little signs of taking the foot of the (stimulus) gas with Chair Powell emphasising that the pandemic presents considerable downside risks in the near term, while also reiterating that it is too soon to be talking about tapering asset purchases. That said, the outlook will continue to remain favourable for the precious metal, particularly as US real yields hold below -100bps. However, while gold prices have steadied, upside has been largely capped by a renewed bid in the greenback.

Potential US Dollar Turning Point Presents a Risk to Gold
The US Dollar has shown tentative signs of a recovery with the DXY maintaining a foothold above the 90.00 handle. In turn the greenback has tested the descending trendline stemming from the March peak. Equity markets have had a challenging week with long/short hedge fund strategies facing pressure from the relentless short squeeze seen in Reddit favourites (AMC, GME), given the plethora of articles surrounding the topic I will save my view for another time. That being said, a factor that has been somewhat underreported has been the draining of liquidity in Chinese markets, in which the PBoC advisor signalled concerns over asset bubbles. Should equity market deleveraging pick up the pace, safe-haven flows into the USD presents a risk for gold.
US Dollar Chart: Weekly Time Frame
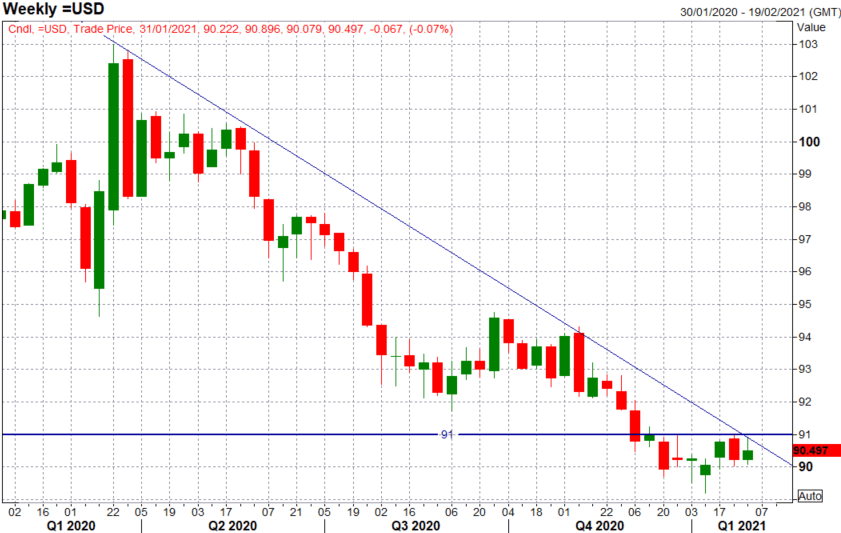
Source: Refinitiv
| Change in | Longs | Shorts | OI |
| Daily | -3% | 11% | 4% |
| Weekly | -1% | -5% | -3% |
Key US Data in Focus: NFP and ISM PMIs
Looking ahead to next week, with it being a new month, the usual NFP data will be closely watched, while ISM PMIs will also garner attention, which could see a revising of US growth prospects.
Gold Price Chart: Weekly Time Frame (50/200DMA Death Cross Approaching)
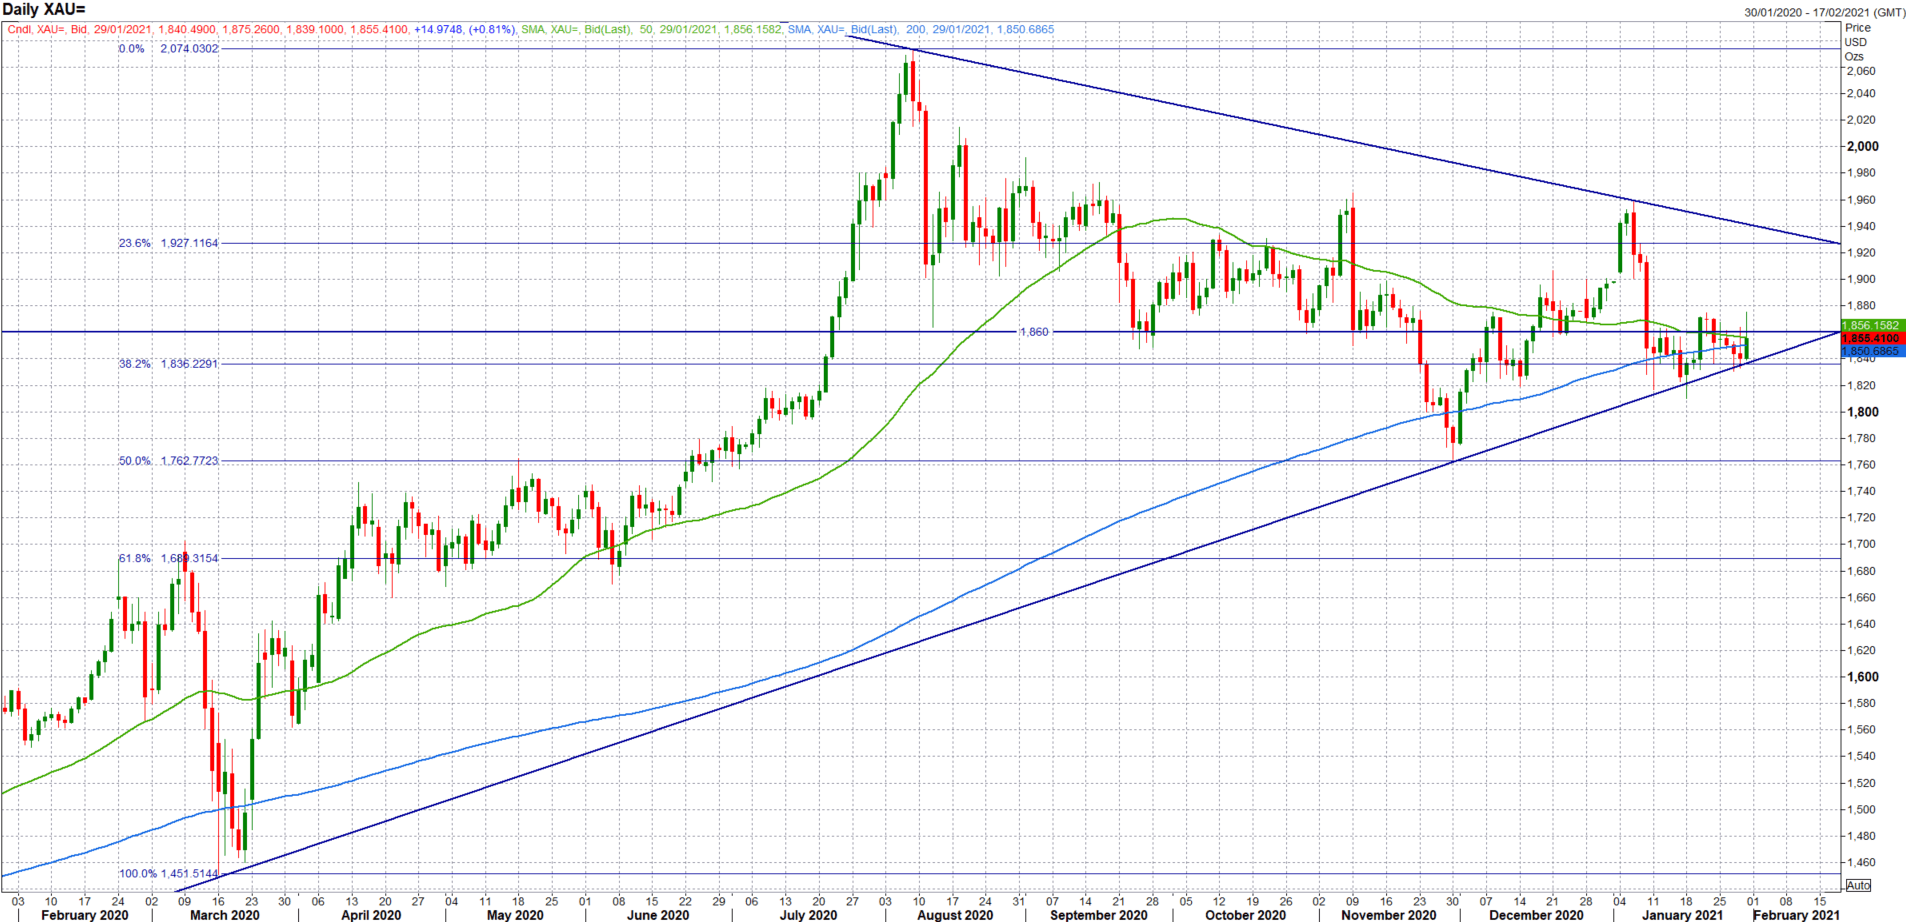
Source: Refinitiv