
Gold Price (XAU/USD), News and Chart
- The coronavirus is now more deadly that the SARS outbreak.
- Gold’s reaction to the flu-like virus has been relatively muted so far.
Gold (XAU/USD) Remains Bid as Coronavirus Spreads
As the official number of people infected with coronavirus grows unabated, US officials are now openly questioning these numbers and calling on China to become transparent over the outbreak. Larry Kudlow, the director of the US National Economic Council said recently that the US is disappointed with China’s response to the virus, adding that they were surprised that the numbers keep ‘jumping around’. As we stand, there are over 64,000 confirmed cases of the virus in China, 588 international cases and 1,383 fatalities. Coronavirus is now more deadly than the 2003 outbreak of SARS when there were 8,098 reported infections and 774 fatalities.
There are also growing fears that the ongoing rally in the equity space – fed by central bank liquidity – are building up to a sharp correction, especially if the Chinese virus is seen to have made a significant dent in global economic activity. A sharp exit from risk-on assets - including equities – may well see the price of gold driven higher as investors look to get into safe-haven assets.
On factor holding gold back from making fresh highs is the strength of the US dollar. The greenback currently trades at a four-month high and the inverse correlation between the two asset classes remains in place.
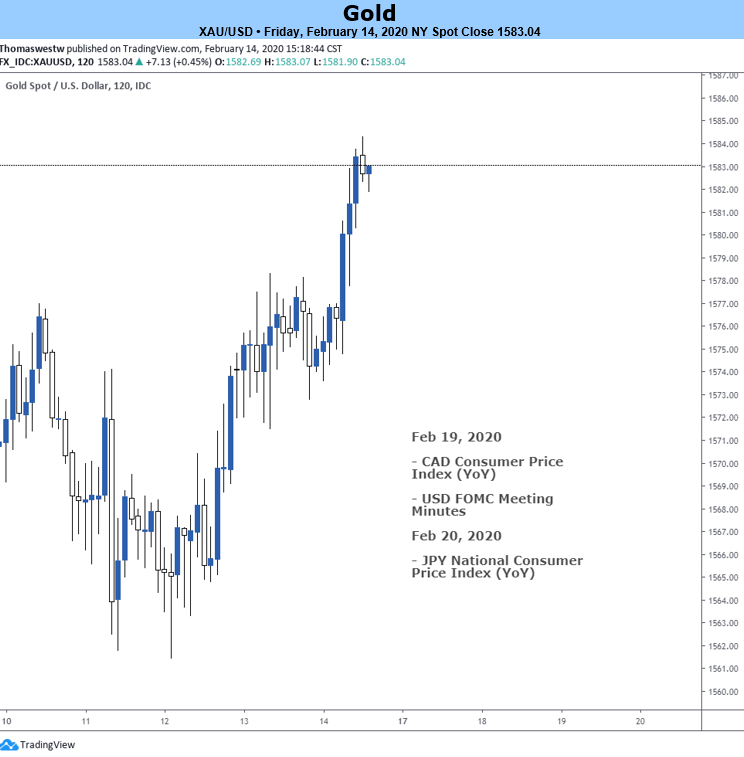
The daily chart shows a bullish pennant formation, with resistance currently under threat. If this formation plays out, the $1,611/oz. recent high will come under pressure if horizontal resistance between $1,590/oz. and $1,592/oz. is broken and closed above.

Gold Daily Price Chart (August 2019 – February 14, 2020)


Traders may be interested in two of our trading guides – Traits of Successful Traders and Top Trading Lessons – while technical analysts are likely to be interested in our latest Elliott Wave Guide.
What is your view on Gold – bullish or bearish?? You can let us know via the form at the end of this piece or you can contact the author via Twitter @nickcawley1.