
GOLD FUNDAMENTAL ANALYSIS HIGHLIGHTS:
- Gold Spikes Above $1600 on Geopolitical Tensions
- Is the Gold Price Breakout a False Alarm
- Eyes on US-China Phase 1 Sign Off

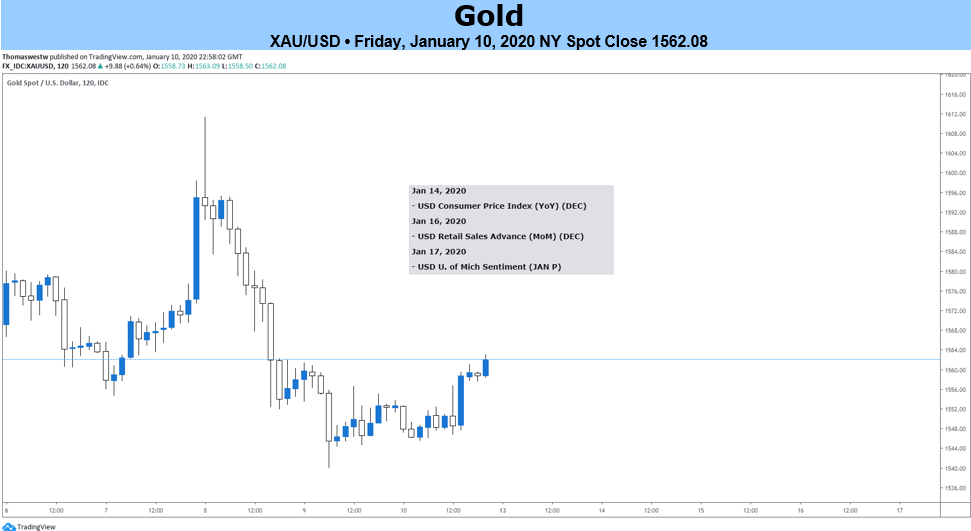
Is the Gold Price breakout a false alarm?
At the beginning of the week, gold prices rallied to its highest level since March 2013 as tensions between the US and Iran escalated. However, financial markets had since calmed down, prompting gold prices to pare its initial spike. Seasonal factors remain positive for the precious metal, which typically gains over 3% (based on 10yr average) in January, so far gold is up 2.7% and while geopolitical tensions will remain on investors radars, it is unlikely to be a lasting driving of financial markets.
Phase 1 and Done?
Next week the US and China are expected to sign off on a Phase 1 trade deal on January 15th. Although, given that it has largely been priced in we expect market reaction to the announcement to be relatively muted and thus attention to move quickly onto the next phase. That said, concerns of a potential delay in the official sign off of the Phase 1 deal would likely provide a lift to gold prices.
US Data in Focus
Elsewhere, market participants will digest a plethora of US data, in particular CPI (14th) and retail sales (16th), With both metrics expected to rebound, this could place a lid on gold prices in the short run.
TECHNICAL LEVELS
| Support | Resistance | ||
|---|---|---|---|
| 1557 | 2019 Peak | 1587 | 61.8% Fib |
| 1550 | - | 1600 | - |
| 1490 | 50DMA | 1611 | YTD Peak |
GOLD PRICE CHART: WEEKLY TIME FRAME (Mar 2011 – Jan 2020)

--- Written by Justin McQueen, Market Analyst
To contact Justin, email him at Justin.mcqueen@ig.com
Follow Justin on Twitter @JMcQueenFX