
Gold Price Fundamental Forecast:Neutral
Q3 2019 Gold Forecast and Top Trading Opportunities
Gold’s Price Correction May Offer Bulls a Better Trade
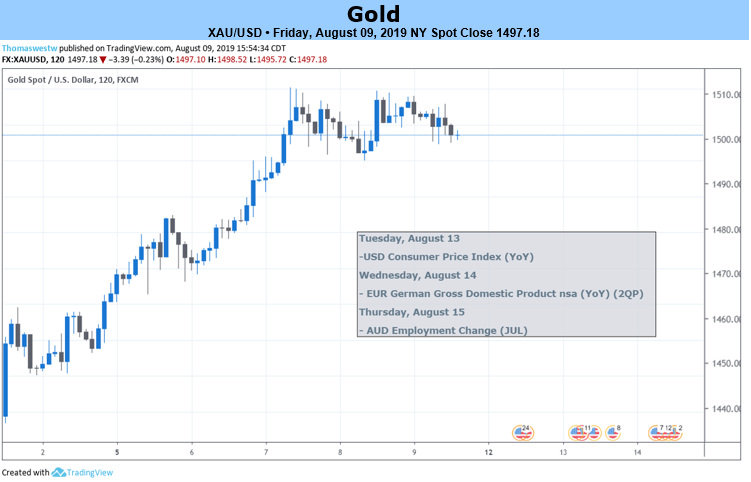
After rallying around $100/oz. over the last eight days, gold has come off its recent multi-year high, but the move lower is currently limited, and any further slippage could trigger a fresh positive bias. All the fundamental factors behind the gold’s rally remain intact – the ongoing US-China trade war, lower-for-longer US interest rates, heightened global growth worries and safe-have status as equity markets become increasingly volatile. All these positive drivers remain and will continue to support the precious metal although the recent sharp movement higher may be partially re-traced as short-term speculators take handsome profits.
Next week’s economic calendar includes a couple of important US economic indicators that need to be watched carefully – July CPI on Tuesday and Retail Sales for the same month on Thursday – but US-China trade news will again be the main driver behind any move. With China effectively negating any US tariffs imposed on their goods by letting/pushing the Chinese Yuan lower against the US dollar, USDCNH should also be watched.
All bull markets have periods of price correction and consolidation and it looks as though gold is currently going through this process. While in the short-term it may not be the best trade to go long at current levels, in the longer-term gold’s price action suggests higher prices. However, it is even harder to suggest going short of gold at these levels with all fundamentals stacked against a sizeable move lower, leaving the sidelines the place to watch the market correction play out. All bull markets have periods of correction and consolidation, as loose holders get shaken out, and gold looks like it is currently following this pattern.
Check out our Technical Analysis section on the website for updated Gold chart levels and prices.
How to Trade Gold: Top Gold Trading Strategies and Tips
Gold Daily Chart (December 2018 - August 9, 2019)

The IG Client Sentiment Indicator shows retail traders are 60.6% net-long Gold, a bearish contrarian bias. However daily and weekly changes give us a stronger bearish Gold bias.
Traders may be interested in two of our trading guides – Traits of Successful Traders and Top Trading Lessons – while technical analysts are likely to be interested in our latest Elliott Wave Guide.
What is your view on Gold – bullish or bearish?? You can let us know via the form at the end of this piece or you can contact the author at nicholas.cawley@ig.com or via Twitter @nickcawley1.