Fundamental Forecast for Gold:Bullish
Gold Talking Points:
- Gold rebound from mult-year support gathers pace post-Powell; supportive above 1180
- What’s driving gold prices? Review DailyFX’s 2018 Gold Projections
- Join Michael for Live Weekly Strategy Webinars on Monday’s at 12:30GMT to discuss this setup and more!
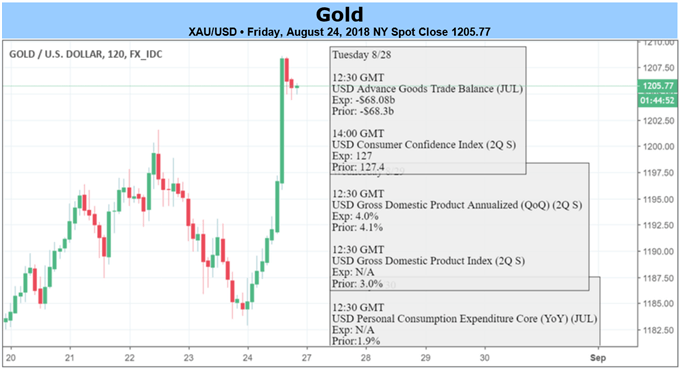
Gold prices snapped a six-week losing streak with the precious metal up more than 1.9% to trade at 1206 ahead of the New York close on Friday. The recovery comes amid continued strength in broader risk markets, with all three major US indices closing higher on the week. Is this a major low in gold? The technicals suggest we’ll find out rather soon.
New to Trading? Get started with this Free Beginners Guide
Jerome Powell Sticks to the Script at Jackson Hole
Comments made by Fed Chair Jerome Powell at the annual economic symposium in Jackson Hole Wyoming offered little guidance to the path of monetary policy. The Chairman downplayed concerns that the US economy was overheating while noting that gradual interest rate hikes remain appropriate given the underlying strength. The remarks fall broadly in-line with market expectations with Fed Fund Futures still pricing a 67% chance for a fourth hike this year in December.
For gold, increasing geo-political tensions and what looks to be a prolonged trade war / tariff skirmish has kept a floor under gold over the past week. A recent bout of weakness in the US Dollar has further fueled the rebound in bullion prices with the DXY turning aggressively lower this week from key structural resistance. Heading into next week the focus is on follow through with gold testing near-term resistance into the close of the week. With price, momentum, and sentiment all coming off extremes, the burden is on the bulls to get through this level and validate that a more significant low is in price.
Learn more about how we Trade the News in our Free Guide !
Spot Gold IG Trader Sentiment

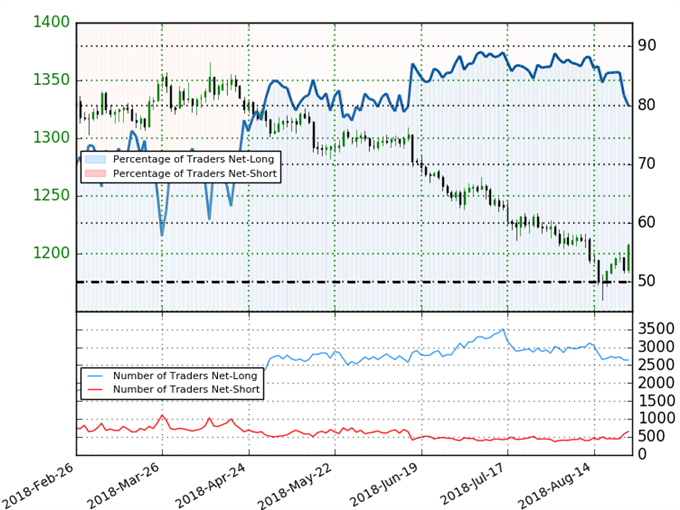
- A summary of IG Client Sentiment shows traders are net-long Gold- the ratio stands at +4.0 (80.0% of traders are long) –bearish reading
- The percentage of traders net-long is now its lowest since June 5th
- Long positions are1.5% lower than yesterday and 3.3% lower from last week
- Short positions are 14.4% higher than yesterday and 32.7% higher from last week
- We typically take a contrarian view to crowd sentiment, and the fact traders are net-long suggests Spot Gold prices may continue to fall. Yet traders are less net-long than yesterday and compared with last week. Recent changes in sentiment warn that the current Spot Gold price trend may soon reverse higher despite the fact traders remain net-long.
Review Michael’s educational series on the Foundations of Technical Analysis: Building a Trading Strategy
Gold Weekly Price Chart

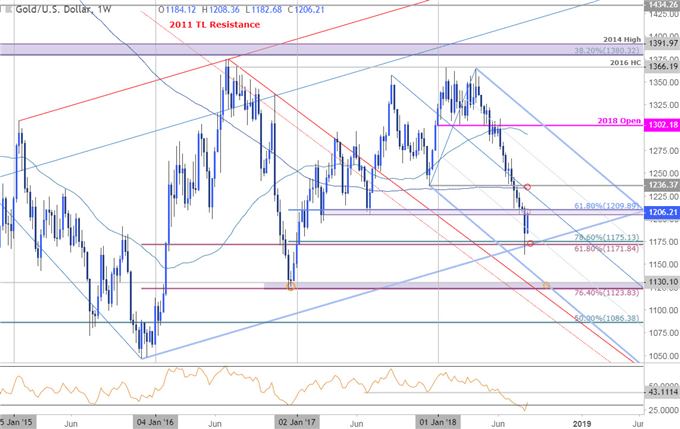
In last week’s Gold forecast our ‘bottom line’ noted that prices were, “testing long-term up-slope support - it’s make-or-break here. From a trading standpoint, we’re looking for a low while above this key zone next week.” The region in question was 1171/75 (78.6% retracement of the 2016 advance, 61.8% retracement of the 2015 advance and parallel support) and heading into next week, the broader focus remains weighted to the topside while above this threshold. Weekly resistance now stands at 1204/09 with a breach above the median-line needed to suggest a more significant low is in place.
Bottom line:
Weekly momentum has recovered from oversold conditions as price responded to key long-term support. From a trading standpoint, I’ll favor fading weakness while above this confluence with a breach above 1209 needed to fuel the next leg higher targeting 1234/36. For a complete technical breakdown of the near-term Gold trading levels (daily & intraday), review this week’s XAU/USD Scalp Report.
Why does the average trader lose? Avoid these Mistakes in your trading
---Written by Michael Boutros, Currency Strategist with DailyFX
Follow Michaelon Twitter @MBForex or contact him at mboutros@dailyfx.com


