
Fundamental Forecast for Gold: Bullish
- Gold prices reverse off key near-term support as Trump proposes steep import tariffs
- What’s driving gold prices? Review DailyFX’s 2018 Gold Projections
- Join Michael for Live Weekly Strategy Webinars on Mondays at 12:30GMT to discuss this setup and more!
Gold prices are lower for the second consecutive week with the precious metal off by nearly 0.6% to trade at 1320 ahead of the New York close on Friday. Despite the decline, price are poised to close the week well-off the lows after a sharp reversal off support on Thursday.
An announcement by President Donald Trump regarding intentions to levy steep tariffs on imported steel and aluminum sparked a substantial sell-off in broader equity markets with traders finding solace in perceived safety of Gold. The move fuels concerns that retaliation from competing countries could instigate a global trade war. This protectionist take on policy may continue to put a floor under gold prices which are still up more than 1.6% year-to-date. Still, there is an opposing force at play.
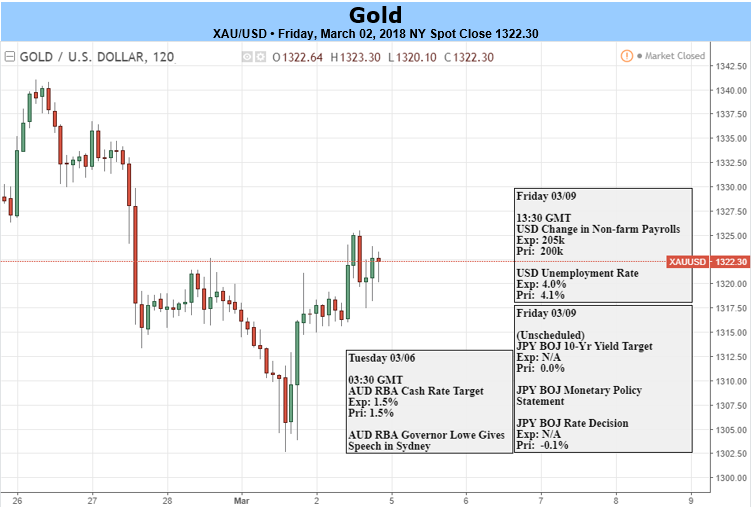
The focus now shifts to key central bank rate decisions next week from the RBA, BoC, BoJ and ECB with the release of the February U.S. Non-Farm Payroll figures (NFP) highlighting the economic docket. For gold, the emphasis will remain on the wage growth numbers next Friday as the inflation outlook remains central focus for the Federal Reserve. As it stands, market participants are factoring three rate hikes this year, (starting with this month) and if the inflation picture improve expectations for higher rates may weigh on demand for gold which does not pay a dividend.
It is this tug of war between interest rate expectations and the perceived threat of inflation / geological risk that has fueled four swings of more than 4% on either side over the past two months. Despite the surge in volatility however, the technical levels remain clear with this week’s low marking a precise 100% extension off the highs- so is a low in place?
New to Trading? Get started with this Free Beginners Guide
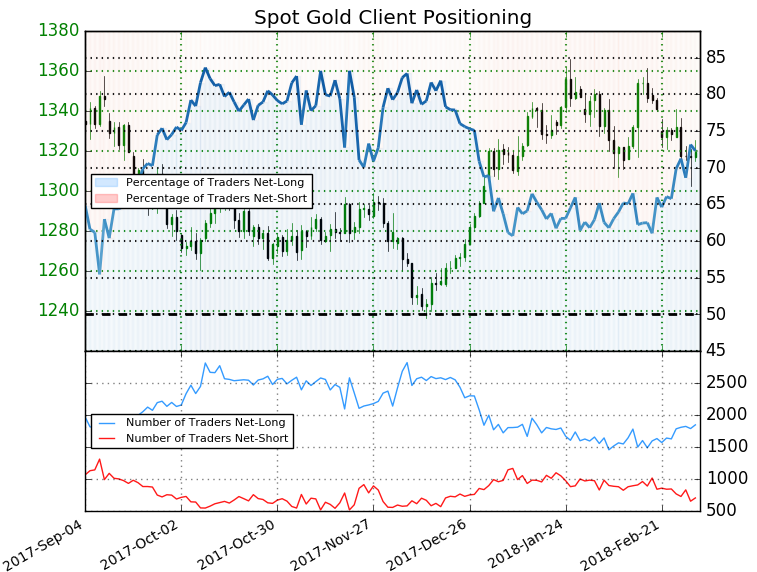
- A summary of IG Client Sentiment shows traders are net-long Gold - the ratio stands at +2.61 (72.3% of traders are long)- bearishreading
- Long positions are 2.8% higher than yesterday and 8.6% higher from last week
- Short positions are15.0% lower than yesterday and 20.4% lower from last week
- We typically take a contrarian view to crowd sentiment, and the fact traders are net-long suggests Spot Gold prices may continue to fall. Traders are further net-long than yesterday and last week, and the combination of current positioning and recent changes gives us a stronger Spot Gold-bearish contrarian trading bias from a sentiment standpoint.
See how shifts in Gold retail positioning are impacting trend- Read more about how to impliment Sentiment in your trading!
Gold Weekly Price Chart
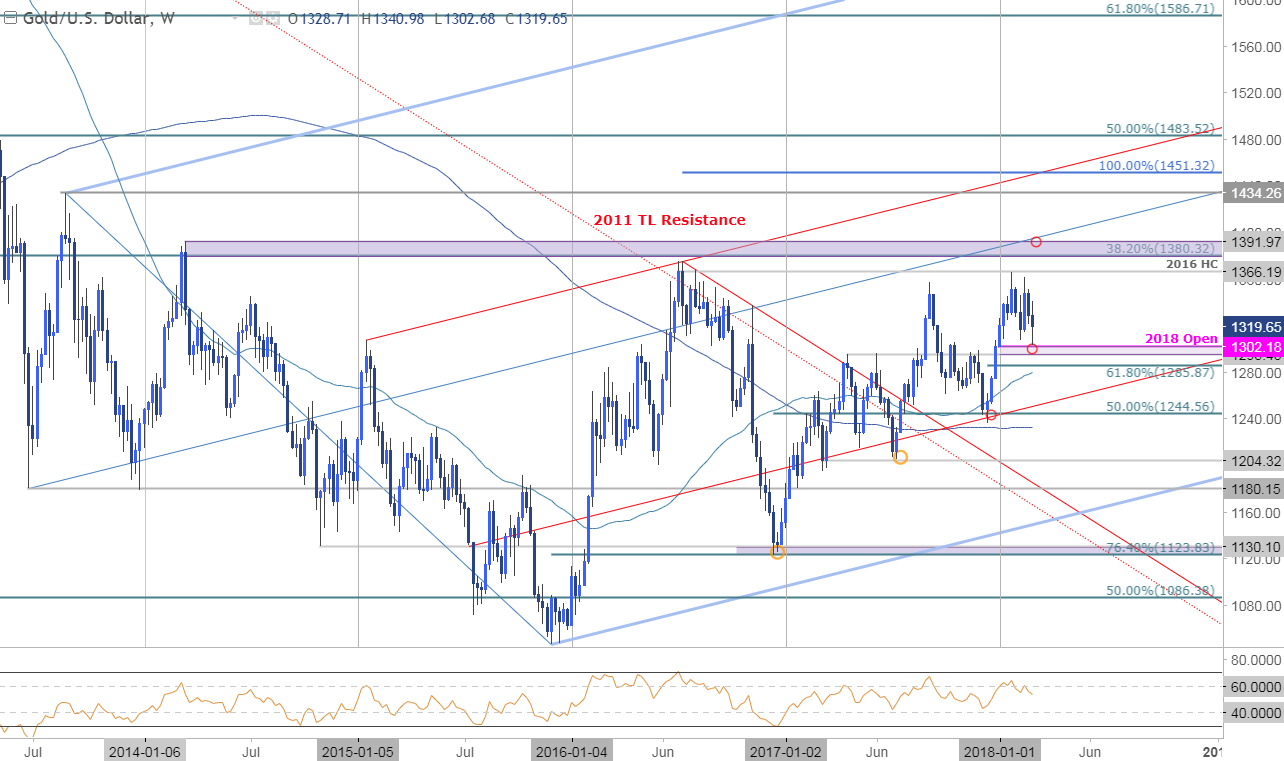
Last week we noted that, “Weekly support rests with the yearly open / April swing highs at 1295-1302.” Price reversed sharply off this threshold this week. Initial weekly resistance remains steady at, “the 2016 high-day close at 1366. Critical resistance remains up at 1380/92 where the 2014 high and 38.2% retracement converge on the median-line of the 2013 broader pitchfork formation (blue).”
Review Michael’s educational series on the Foundations of Technical Analysis
Gold Daily
Price Chart
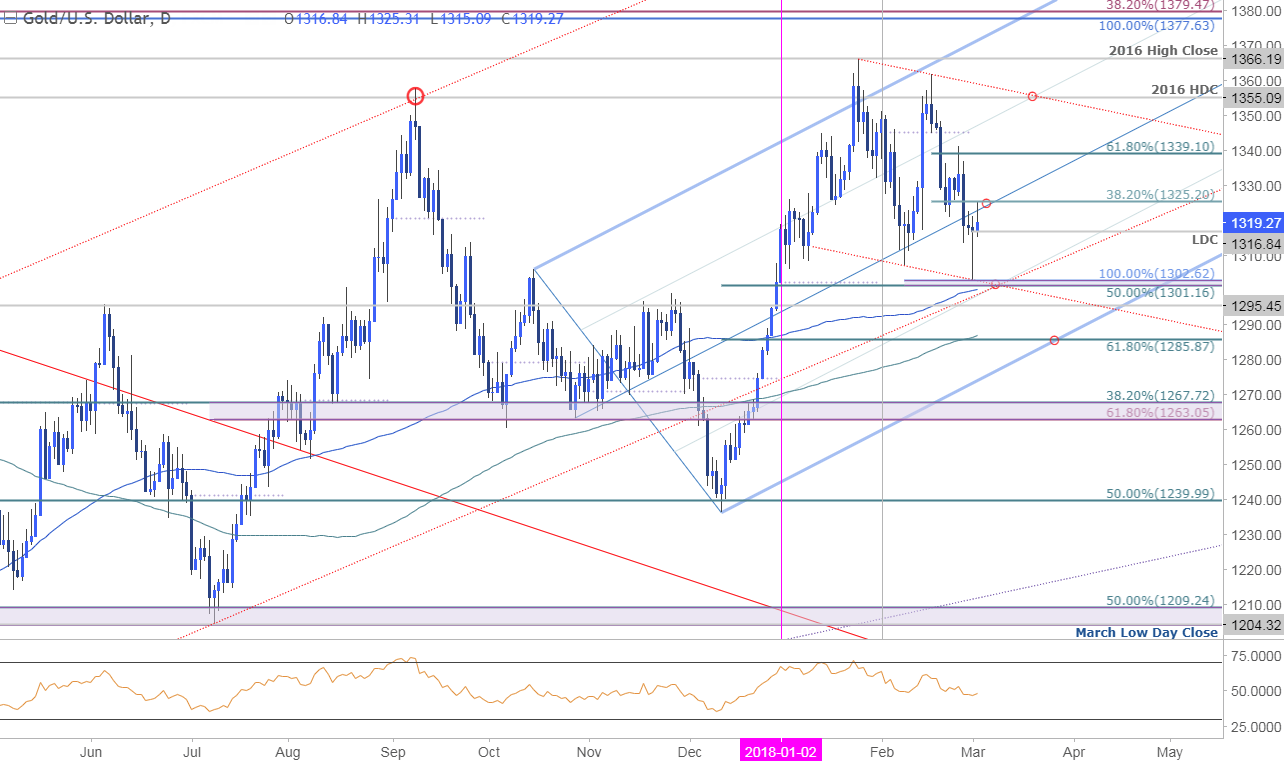
The daily chart highlights a pair of parallels (red) continuing to govern price action since the yearly high with gold rebounding sharply off confluence support at the lower parallel this week. Initial daily resistance stands at median-line / 38.2% retracement at 1325 backed by 1339. Ultimately a breach above the 2016 high-day close at 1355 would be needed to mark resumption of the broader uptrend.
What are the traits of a Successful Trader? Find out with our Free eBook !
Gold 240min Price Chart

A closer look at gold sees prices rebounding off the median-line of this descending pitchfork formation we’ve been tracking since last week. A breach above resistance here looks for a stretch into the upper parallel / 50% retracement at 1332- a close above this level would be needed to suggest a near-term low is in place with such a scenario targeting a rally back towards 1339 and the 2017 high-day close at 1346.
Bottom line: Look to fade weakness early next week while above 1300 with a topside breach of this multi-week formation needed to fuel the next leg higher in Gold. A break below this support barrier would invalidate the reversal play and keep the focus lower towards subsequent support objectives at 1295 and the 61.8% retracement at 1286.
---Written by Michael Boutros, Currency Strategist with DailyFX
Follow Michaelon Twitter @MBForex contact him at mboutros@dailyfx.com or Subscribe to his email distribution list.