

Fundamental Forecast for Gold: Neutral
- Gold prices lower but continue to consolidate with the January range- US GDP in focus
- What’s driving gold prices? Review DailyFX’s 2018 Gold Projections
- Join Michael for Live Weekly Strategy Webinars on Mondays at 12:30GMT to discuss this setup
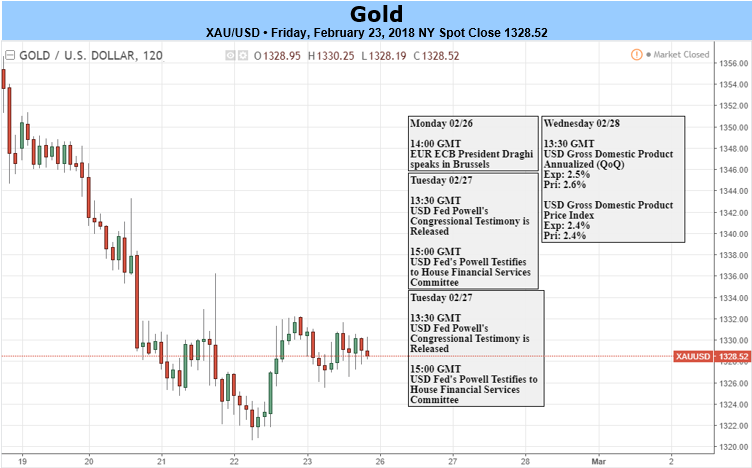
Gold prices are lower this week with the precious metal off by more than 1.3% to trade at 1328 ahead of the New York close on Friday. The move is on pace to mark the largest weekly decline this year and comes on the back of a rebound in the greenback. Despite the declines however, price has continued to consolidate within the broader January range.
Minutes from the latest FOMC policy meeting released this week suggests Fed officials see an “increased likelihood” for “further” interest-rate increases this year. Higher rates tend to weigh on demand for non-yielding assets like gold but losses have been limited as the outlook for inflation continues to build. While the fundamental picture remains clouded by these opposing forces, the broader technical picture remains clear and for now, the pullback remains within the confines of longer-term uptrend.
Looking ahead to next week the focus will be on the second read on U.S. 4Q GDP figures with consensus estimates calling for a downward revision to an annualized 2.5% q/q from 2.6 q/q. For gold, prices may yet have lower to go but we’re generally on the lookout for support heading into the March open.
New to Trading? Get started with this Free Beginners Guide
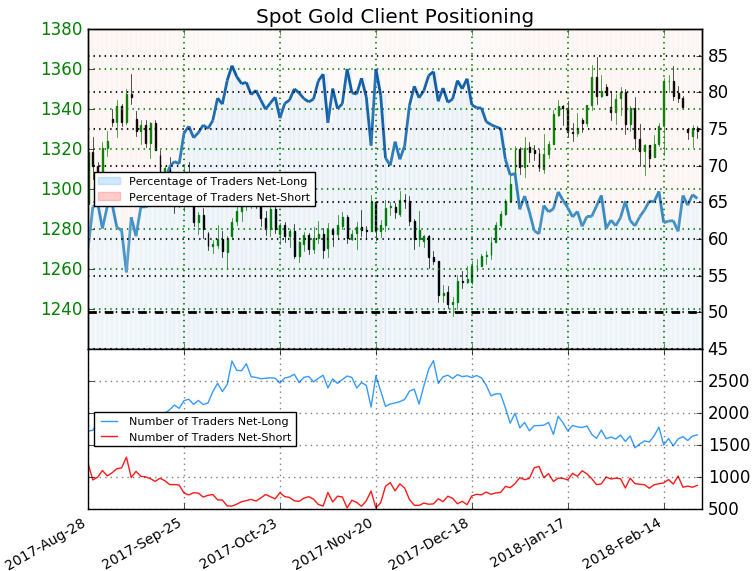
- A summary of IG Client Sentiment shows traders are net-long Gold - the ratio stands at +1.9 (65.5% of traders are long)- bearish reading
- Long positions are 0.8% lower than yesterday and 2.5% higher from last week
- Short positions are 0.6% higher than yesterday and 13.8% lower from last week
- We typically take a contrarian view to crowd sentiment, and the fact traders are net-long suggests Spot Gold prices may continue to fall. However retail traders are less net-long than yesterday but more net-long from last week and the combination of current positioning and recent changes gives us a further mixed Spot Gold trading bias from a sentiment standpoint.
See how shifts in Gold retail positioning are impacting trend- Read more about how to impliment Sentiment in your trading!
Gold Weekly Price Chart
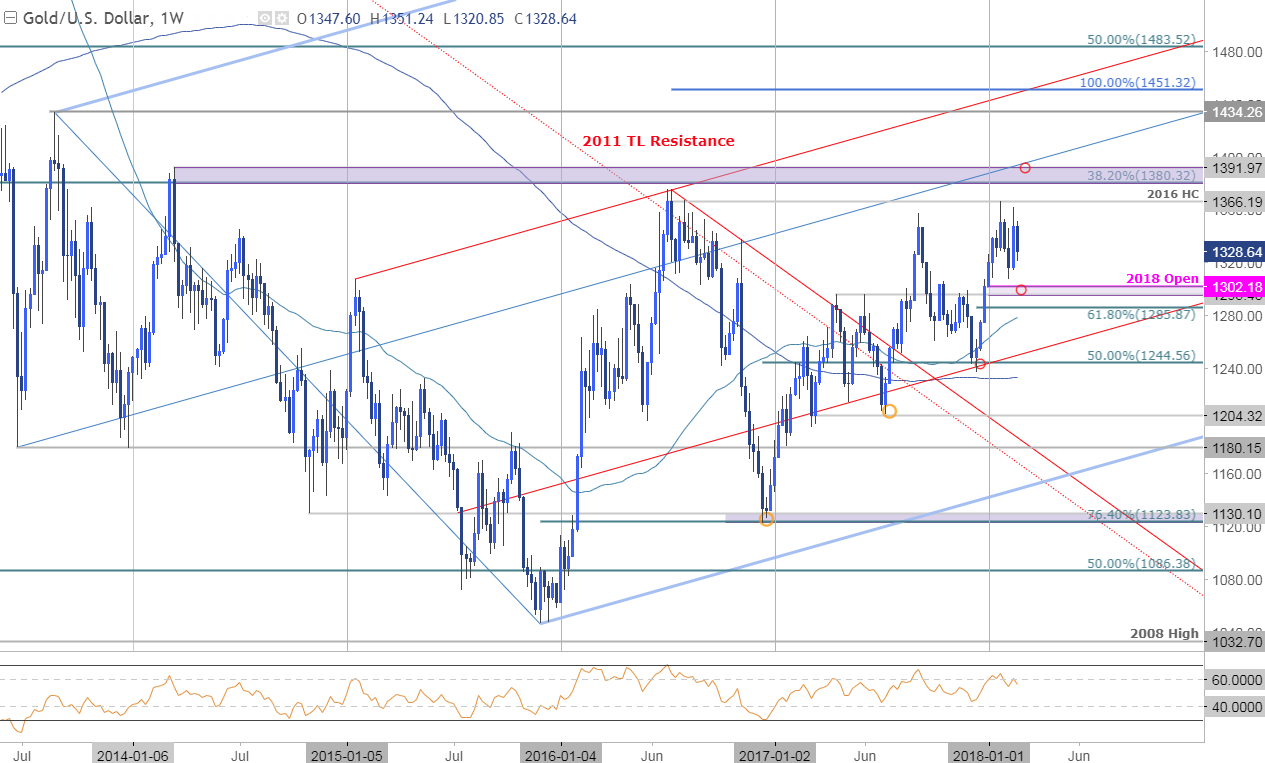
Gold prices have continued to consolidate below the yearly high with January high with a clear yearly opening range taking shape. Weekly support rests with the yearly open / April swing highs at 1295-1302.
Initial resistance steady at, “the 2016 high-day close at 1366. Critical resistance remains up at 1380/92 where the 2014 high and 38.2% retracement converge on the median-line of the 2013 broader pitchfork formation (blue).”
Review Michael’s educational series on the Foundations of Technical Analysis
Gold Daily
Price Chart
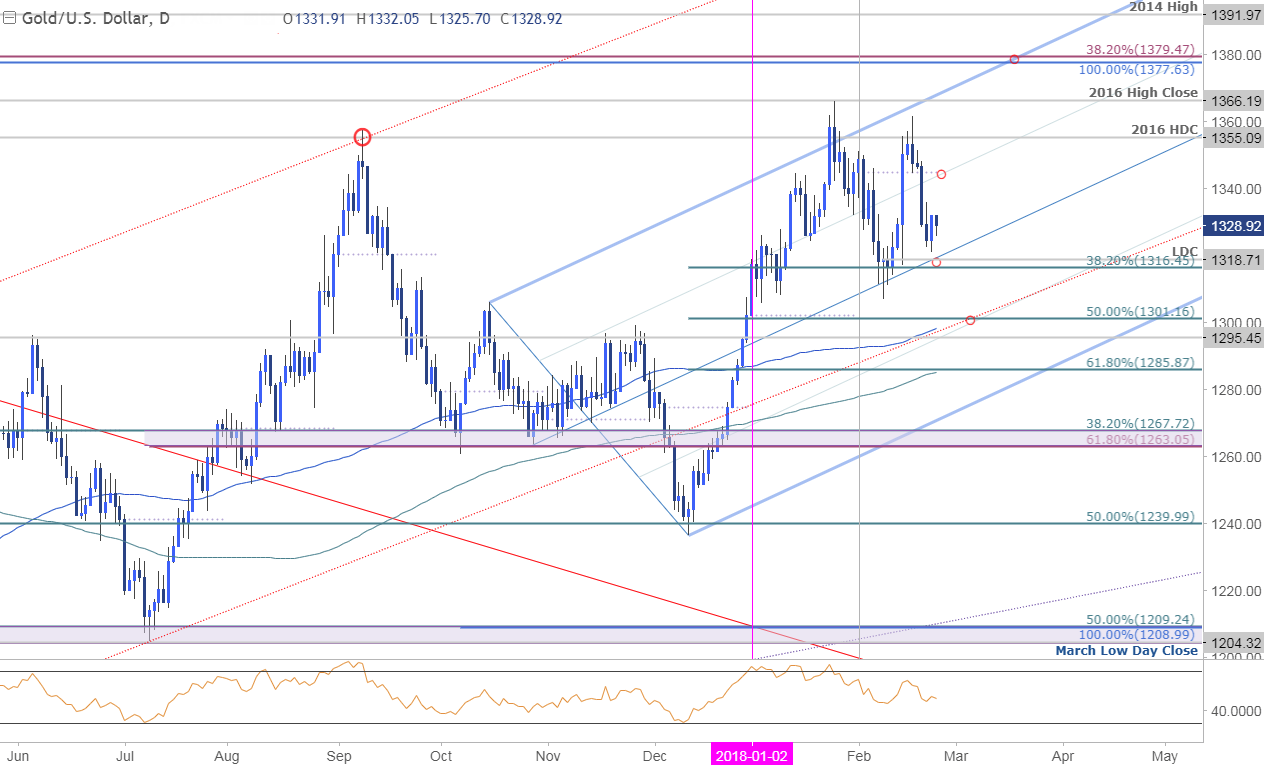
A sharp reversal just ahead of the pitchfork resistance late-last week followed through with a break below the monthly open at 1345 fueling accelerated losses in gold prices. Interim support now rests at 1316/18 – a break there risks a larger correction towards the 1295-1301 support zone.
What are the traits of a Successful Trader? Find out with our Free eBook !
Gold 240min Price Chart
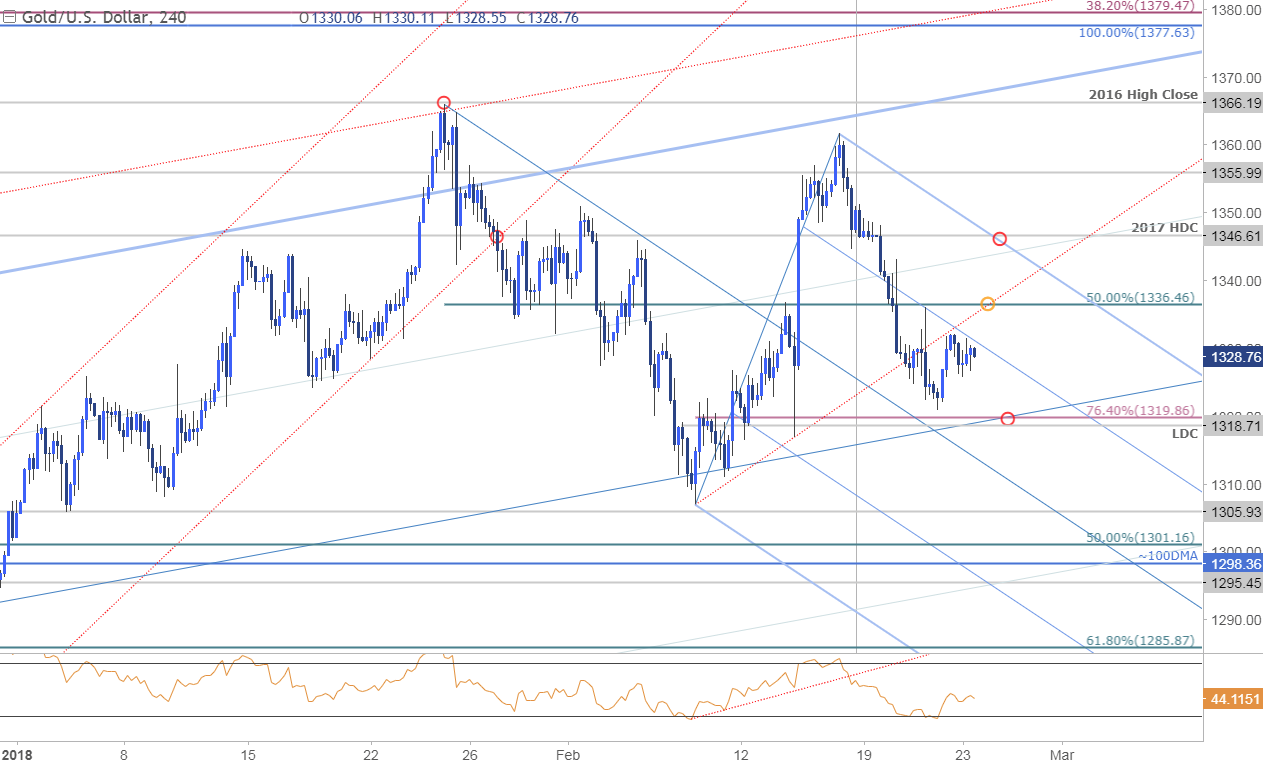
A closer look at gold sees prices trading within the confines of a descending pitchfork formation extending off the yearly highs with the upper parallel highlighting near-term bearish invalidation at the monthly open / 2017 HDC at 1345/46. Look for interim resistance at 1336 heading into next week with confluence support eyed at the monthly low-day close at 1318- look for a reaction there (area of interest for near-term exhaustion).
Bottom line: We could see a continued reprieve of the recent downside pressure early next week but the risk remains lower while within this formation and we’ll be looking for a reaction on a move into 1318.
---Written by Michael Boutros, Currency Strategist with DailyFX
Follow Michael on Twitter @MBForex contact him at mboutros@dailyfx.com or Click Here to be added to his email distribution list.