


Fundamental Forecast for Gold:Neutral
- Gold prices mark 5% decline off January highs amid equity sell-off; technicals eye support
- What’s driving gold prices? Review DailyFX’s 2018 Gold Projections
- Join Michael for Live Weekly Strategy Webinars on Mondays at 12:30GMT to discuss this setup
Gold prices are fell for the second consecutive week with the precious metal off by more than 1.5% to trade at 1312 ahead of the New York close on Friday. The losses come amid a tumultuous week in equity markets with all three major US stock indices trading lower by nearly 8%. The total declines off the January record highs takes us into correction territory with the indices now trading lower year-to-date. For gold, the panic offered little support with bullion continuing to target the 2018 open just lower.
Headlines continue to be dominated by speculation that last Friday’s strong Non-Farm Payrolls figures (specifically wage growth) have spooked market participants over fears of rising inflation which could stoke the Federal Reserve to tighten at a faster pace. Gold is caught in a tug-of-war from a fundamental standpoint. An increase in inflation expectations would typically be supportive but the focus on how this may impact the path for monetary policy continues to outweigh sentiment.
Continued strength in the U.S. Dollar has also weighed on Gold prices with the DXY building on last week’s reversal with a 1.6% rally. Next week traders will be closely eyeing more inflation data with the release of the January U.S. Consumer Price Index (CPI) and Retail Sales on tap for Wednesday. From a technical standpoint, there’s a little more room for further losses near-term, but we’re generally on the lookout for a near-term low heading deeper into February trade.
New to Trading? Get started with this Free Beginners Guide

- A summary of IG Client Sentiment shows traders are net-long Gold - the ratio stands at +1.8 (64.3% of traders are long)- bearish reading
- Long positions are 4.4% higher than yesterday and 6.8% lower from last week
- Short positions are 9.4% lower than yesterday and 9.7% lower from last week
- We typically take a contrarian view to crowd sentiment, and the fact traders are net-long suggests Spot Gold prices may continue to fall. Traders are further net-long than yesterday and last week, and the combination of current positioning and recent changes gives us a stronger Spot Gold-bearish contrarian trading bias from a sentiment standpoint.
Review Michael’s educational series on the Foundations of Technical Analysis
Gold Weekly Price Chart

Despite this week’s volatility, the broader gold outlook remains unchanged- “Gold prices reversed sharply off the 2016 high-close at 1366 last week with decline taking out the entire previous weeks advance. The broader uptrend remains vulnerable heading into next week with support eyed at 1295-1302 backed by our bullish invalidation at 1285. A breach higher targets key confluence resistance at 1380/92.”
What are the traits of a Successful Trader? Find out with our Free eBook !
Gold Daily
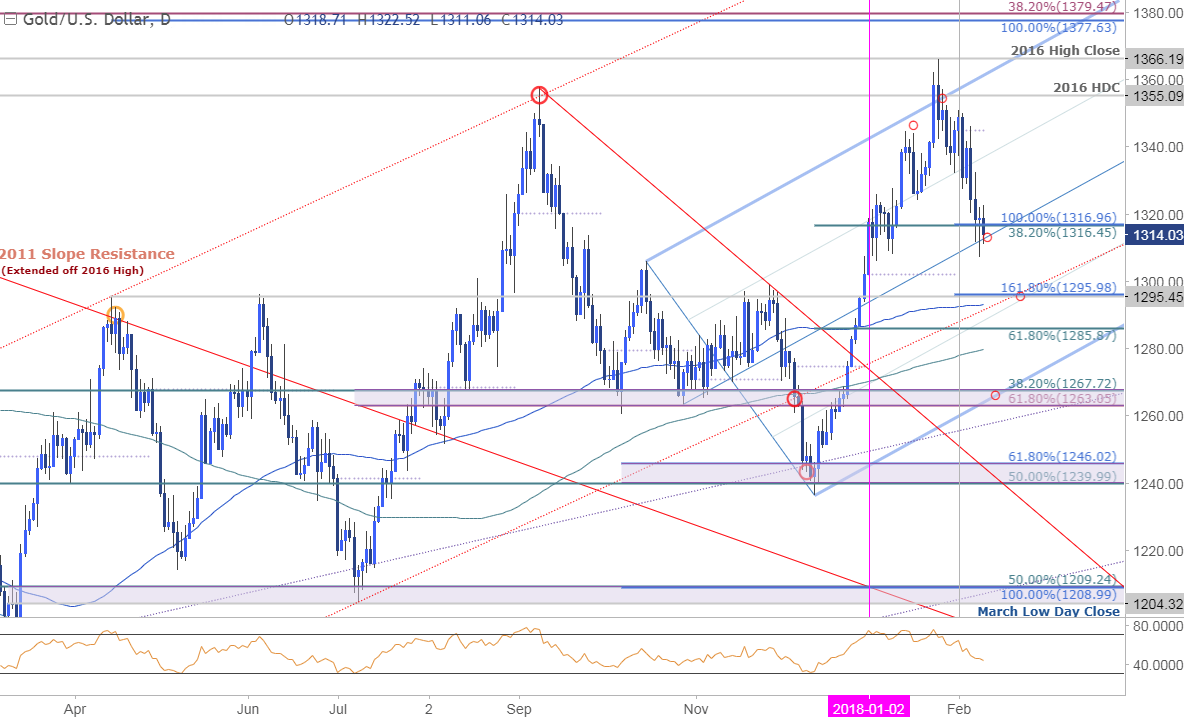
Last week we noted that “the RSI profile now casts a corrective stance on momentum with the oscillator breaking back from overbought condition.” The decline is now testing the median-line of the ascending pitchfork formation we’ve been tracking. A weekly close below this level risks a decline back towards the 50-line which converges on a horizontal resistance at 1295/96.
Gold 240min
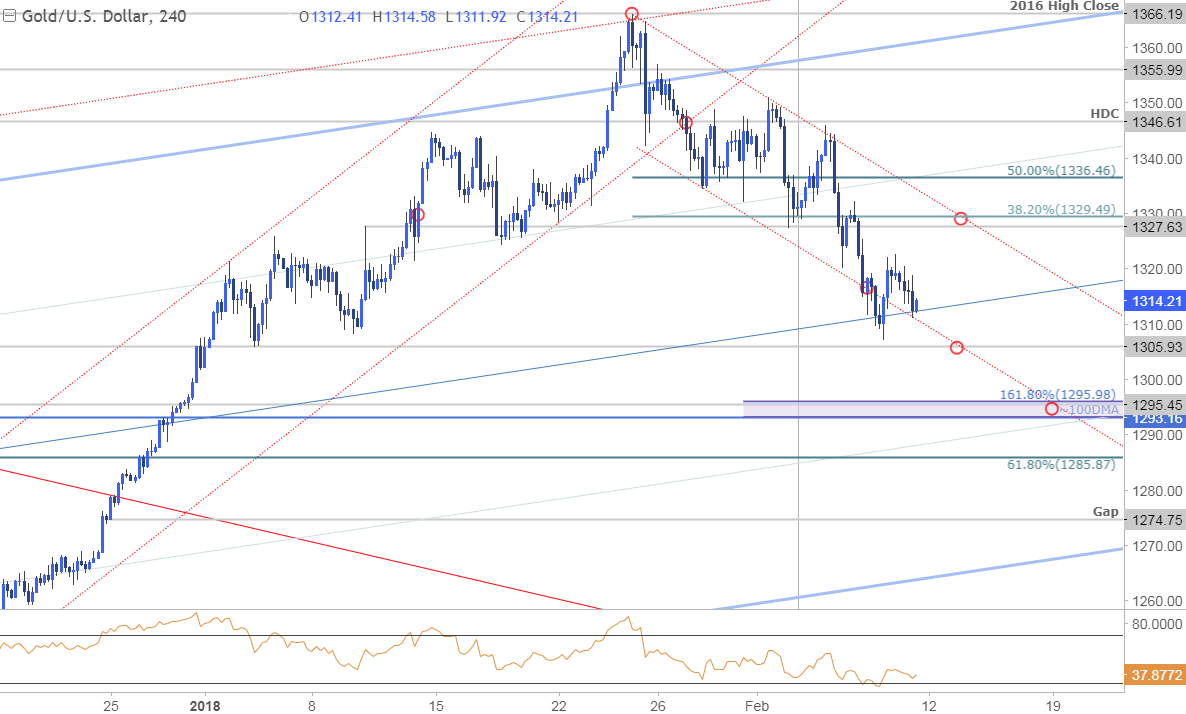
A closer look at gold sees prices turning just ahead of the October high at 1305 with the broader decline largely trading within the confines of a near-term descending channel formation. We could see some relief early next week but the risk remains lower while below 1327/29 with a break lower targeting key support targets at 1293/95 & 1285- both levels of interest for possible exhaustion / long-entries IF reached. (note that a possible head & shoulders break this week highlights the risk for a measured move into 1288). Bottom line: the risk is lower next week with the decline to ultimately offer more favorable entries within the broader up-trend.
---Written by Michael Boutros, Currency Strategist with DailyFX
Follow Michael on Twitter @MBForex contact him at mboutros@dailyfx.com or Click Here to be added to his email distribution list.