Fundamental Forecast for Gold:Neutral
- Gold fails at key long-term technical resistance- FOMC to charge break of June opening range
- What’s driving gold prices? Review DailyFX’s 2Q Gold Projections
- Join Michael for Live Weekly Strategy Webinars on Mondays at 12:30GMT
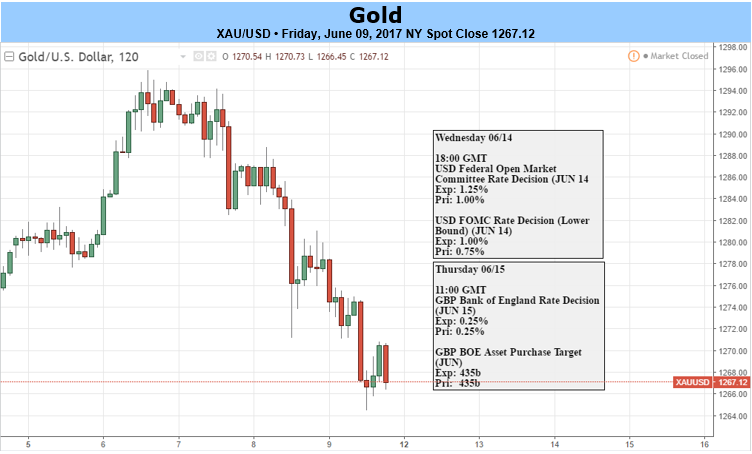
Gold prices snapped a three week winning streak with the precious metal down nearly 0.9% to trade at 1267 ahead of the New York close on Friday. Pressured by a slight rebound in the U.S. Dollar, the decline accelerated late in the week on the back of the major event risk this week with markets seemingly unfazed by the week’s developments.
Major headline risk fueled a pop higher in gold early in the week but the advance quickly fizzled. A less dovish ECB and no ‘smoking gun’ in the former FBI Director James Comey’s testimony before the senate intelligence committee saw gold prices sharply retreat back below a key area of technical resistance this week. Even a surprise upset in the UK elections was unable to fuel demand after Theresa May lost her general majority in the House of Commons. So is the gold rally over? Well, we’re not out of the woods just yet. . .
Heading into next week, all eyes fall on the Federal Reserve with the June interest rate decision and subsequent presser with Chair Janet Yellen slated for Wednesday. Market participants are widely expecting the central bank to raise the benchmark interest rate by 25bps and the focus will be on the updated quarterly projections as they pertain to growth, inflation and employment. The all-important interest rate dot-plot will be crucial in assessing the projected path of subsequent hikes and for gold prices, will be the most critical aspect of the release.

- A summary of IG Client Sentiment shows traders are net-long Gold - the ratio stands at +2.06 (67.3% of traders are long)- bearishreading
- Last week the ratio was at its lowest levels since April 23th- Ratio has narrowed since then as price pulled back
- Long positions are 6.5% lower than yesterday and 16.3% lower from last week
- Short positions are 11.9% lower than yesterday but a full 22.0% higher from last week
- Despite the fact that sentiment continues to point lower, the marked increase in short exposure from last week highlights softens the bearish outlook- especially as long positions continue to wane.
Find out what current Gold positioning is saying about the current trend. Get more information on Sentiment here Free !
Gold Daily

Last week we noted that, “we’ll be on the lookout for near-term exhaustion up here with the immediate long-bias at risk heading into June trade.” Indeed gold rallied through AND failed to hold above long-term trendline resistance extending off the record 2011 high with prices looking to close the week just above confluence support at the 38.2% retracement of the May advance and the monthly open at 1264/67. The weekly reversal back below support casts a shadow on this breakout & leaves the advance vulnerable heading into next week. Note that daily momentum has also made a clear rejection of the 70-threshold. That said, prices have now carved out a clear monthly opening range and heading into key event risk next week, we’ll be looking for the break to offer further guidance on our near-term directional bias.
Gold 240min
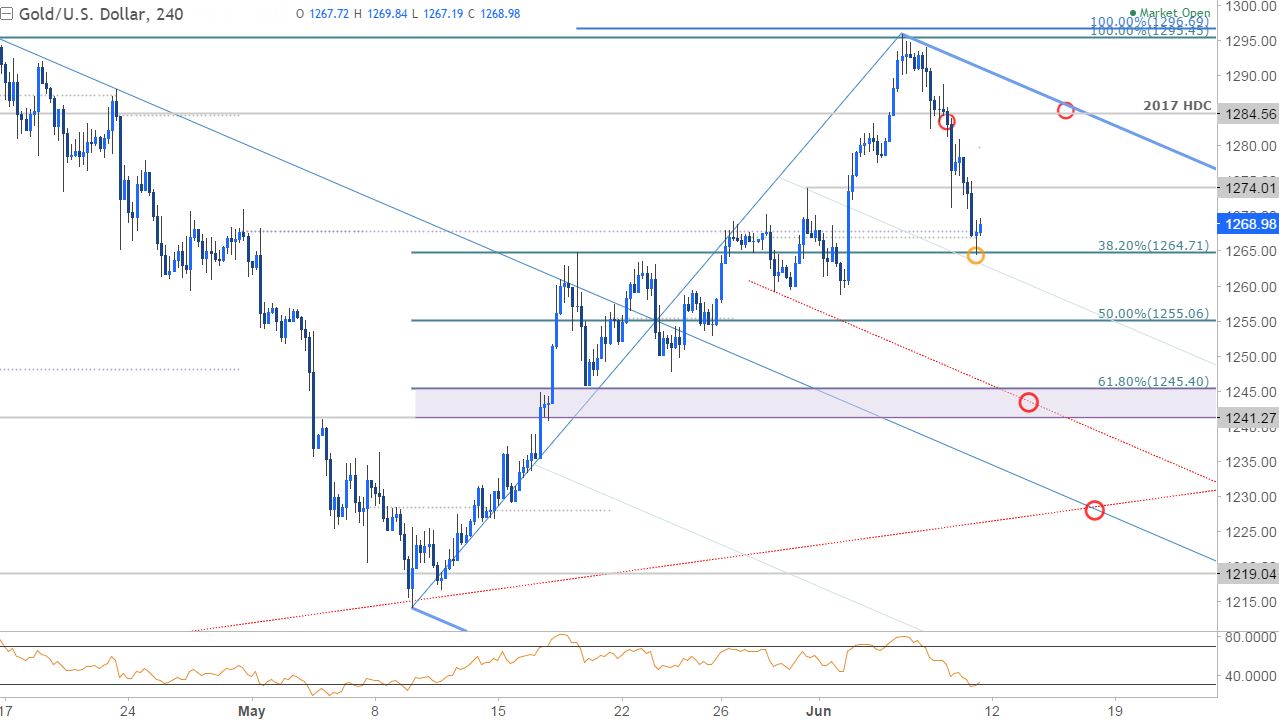
A closer look at price action highlights this week’s reversal back into monthly open support. A newly identified descending pitchfork formation has been added and although it’s too early to rely on, the 50-line further highlights near-term support at Friday’s low. Interim resistance now stands at 1274 with a breach above the 2017 high-day close needed to shift the focus back to the long-side targeting the 1293/96 resistance range. A break below this threshold targets 1255 and a more significant support zone at 1241/45- a region defined by the 61.8% retracement, the 100-day moving average and the October swing lows. Bottom line: look to fade strength sub-1284 heading into next week with a break sub 1264 needed to keep the near-term reversal-play operative.
---Written by Michael Boutros, Currency Strategist with DailyFX
Follow Michaelon Twitter @MBForex contact him at mboutros@dailyfx.com or Click Here to be added to his email distribution list.