Fundamental Forecast for Gold:Neutral
- Gold testing key multi-year trendline resistance-
- What’s driving gold prices? Review DailyFX’s 2Q Gold Projections
- Join Michael for Live Weekly Strategy Webinars on Mondays at 12:30GMT
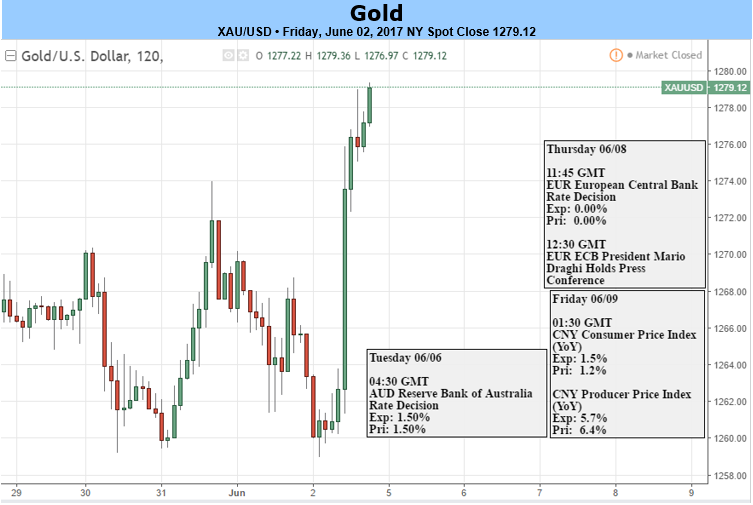
Gold prices rallied for a third consecutive week with the precious metal up more than 0.8% to trade at 1276 ahead of the New York close on Friday. The advance comes alongside continued strength in broader risk assets with all three major U.S. indices looking to close at fresh record highs. Bullion prices are now back at key structural resistance levels and heading into the start of June trade, this seemingly symbiotic relationship with risk
U.S. Non-Farm Payrolls disappointed on Friday with a lackluster print of just 138K as the Labor Force Participation rate fell to 62.7%, its lowest clip since December. Still, even with downward revisions to last month’s strong report, the expectations for a Fed rate-hike this month remain well anchored with Fed Fund Futures pricing a greater than 80% probability. Looking ahead to next week, traders will be eagerly awaiting central bank rate decisions from the Reserve Bank of Australia (RBA) & the European Central Bank (ECB). For gold prices however, the focus is on a key technical resistance slope extending off the all-time record highs – a level that is now in focus heading into June trade.
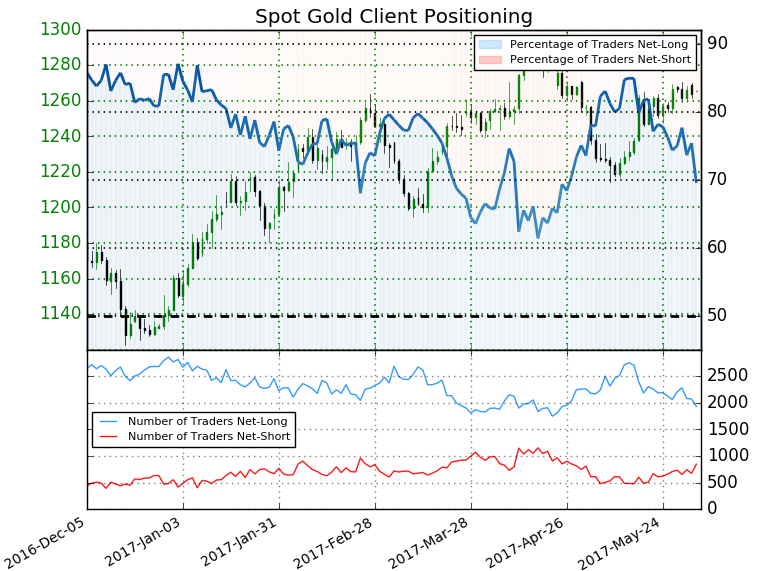
- A summary of IG Client Sentiment shows traders are net-long Gold - the ratio stands at +2.28 (69.5% of traders are long)- bearishreading
- The ratio is now at its lowest levels since April 23th
- Long positions are 10.0% lower than yesterday and 10.0% lower from last week
- Short positions are 15.2% higher than yesterday and a full 20.8% higher from last week
- Despite the fact that sentiment continues to point lower, the marked increase in short exposure highlights the breakout potential here- especially as prices approach key near-term structural resistance. That said, we’ll be on the lookout for near-term exhaustion up here with the immediate long-bias at risk heading into June trade.
Find out what current Gold positioning is saying about the current trend. Get more information on Sentiment here Free !
Gold Weekly
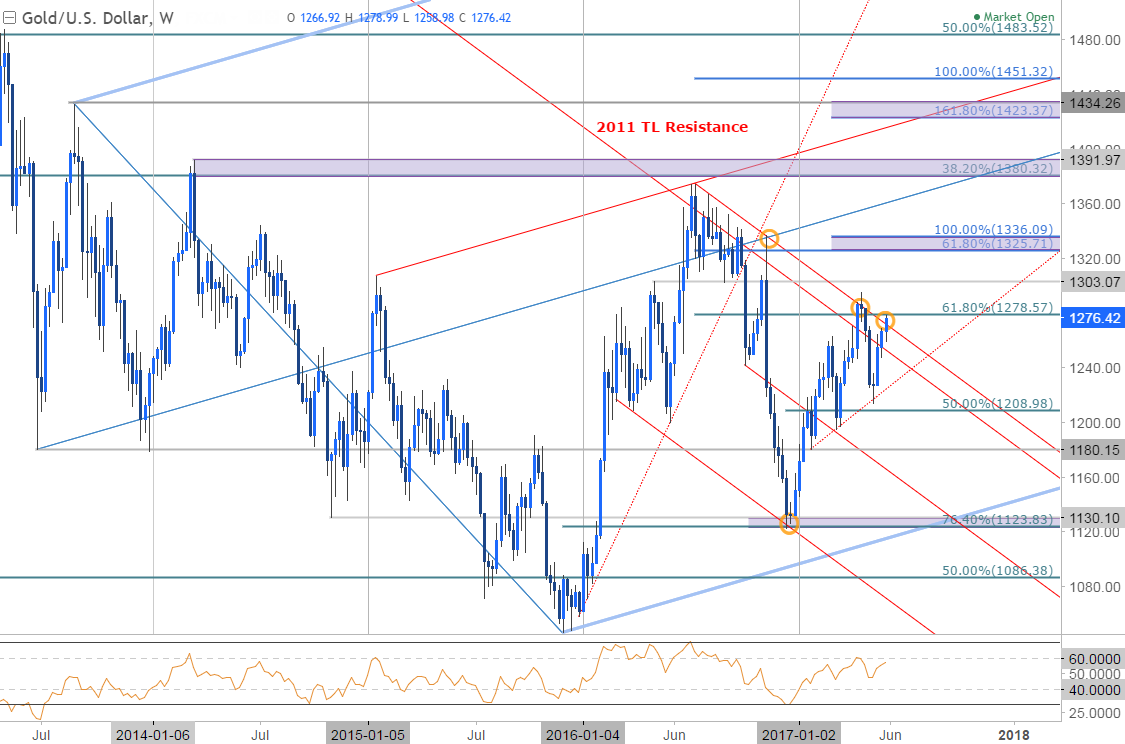
Gold prices are now approaching a critical resistance barrier around 1278- a level that has marked several swing highs & lows in price action and is defined by the 61.8 % retracement of the mid-2016 decline and basic trendline resistance extending off the 2016 high. Note that this trendline is an exact parallel of the slope extending off the 2011 high and is the last line of defense for the bears.
Gold Daily
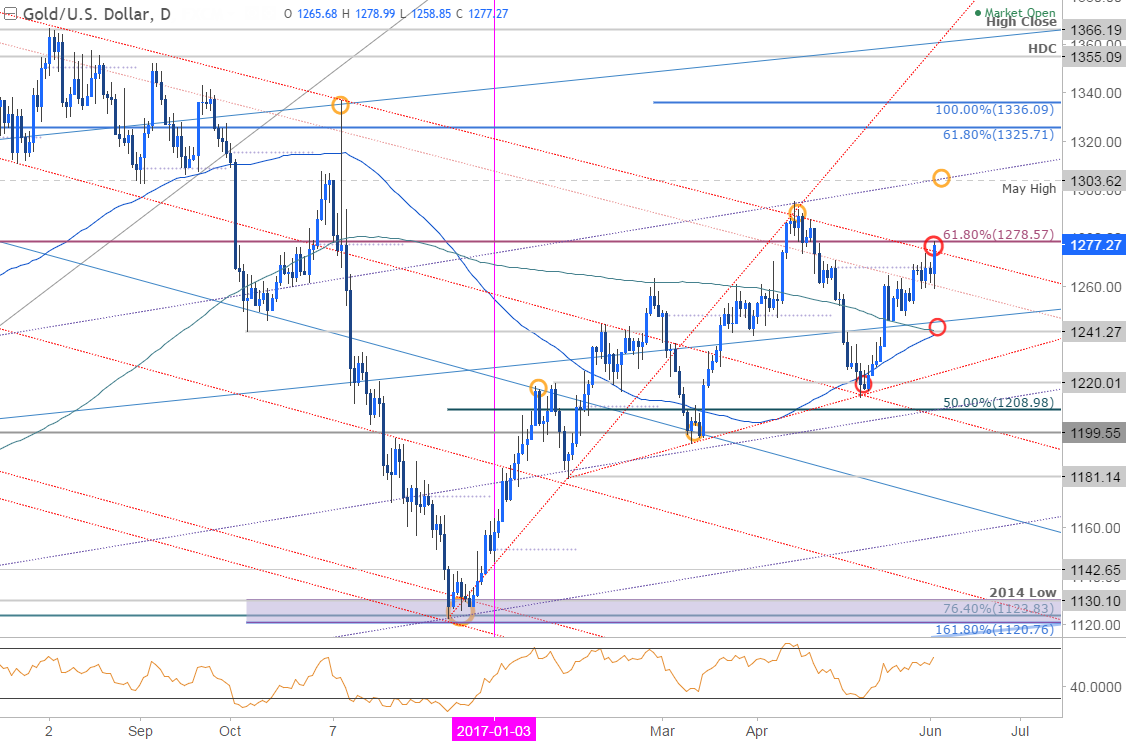
A look at the daily chart further highlights this key resistance threshold. A weekly close above this region eyes initial targets at 1303 backed by the 1325 and the 100 % extension of the advance off the 2016 low at 1336. Look for initial support at this week’s lows with a break sub 1240/42 needed to shift the focus more firmly to the downside. As always, we’ll want to use some caution here heading into the June open with the monthly opening range likely to offer further guidance- especially as it takes shape just below key slope resistance. Bottom line- Gold is at key resistance and its make or break at these levels.
---Written by Michael Boutros, Currency Strategist with DailyFX
Follow Michaelon Twitter @MBForex contact him at mboutros@dailyfx.com or Click Here to be added to his email distribution list.