
Canadian Dollar Weekly Forecast: USD/CAD Braces Ahead of Key U.S. Economic Data
Teaser: USD/CAD will be subject to USD specific factors next week as the Canadian dollar remains exposed to downside risk.
USD/CAD Analysis
- CAD under pressure despite crude oil comeback.
- Jackson Hole inches closer.
USD/CAD FUNDAMENTAL BACKDROP
The Canadian dollar suffered the same fate as the rest of FX markets last week with the U.S. dollar taking the lead after markets reacted favorably to the greenback post-FOMC. Canadian retail sales managed to claw back some losses on Friday showing a gradual and consistent improvement in the retail environment. Of course this has not been adjusted for inflation so it will be interesting to see whether or not the adjusted figure is net positive.
From a crude oil perspective, a marked reduction in U.S. stockpiles were not enough to deter a surging USD with both the API and EIA releases helping lift crude oil prices. Looking ahead, the coming week is dominated with U.S. centric data with focus on the Jackson Hole Symposium towards the end of the week.
USD/CAD ECONOMIC CALENDAR
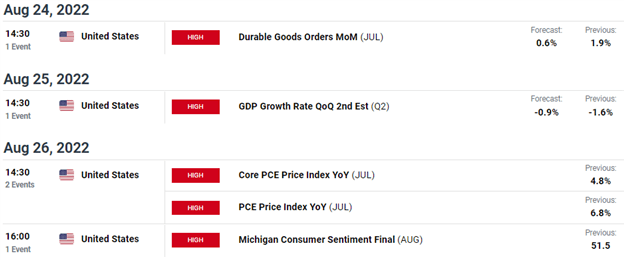
Source: DailyFX Economic Calendar

TECHNICAL ANALYSIS
USD/CAD DAILY CHART
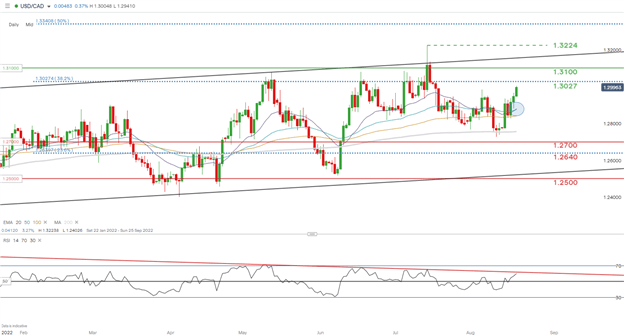
Chart prepared by Warren Venketas, IG

Price action on the daily USD/CAD chart above shows the recent dollar rally pushing up towards the 1.3027 (38.2% Fibonacci) resistance zone. We may see some profit taking around these levels which should coincide with the Relative Strength Index (RSI) resistance (red). From a bullish perspective, the potential bullish EMA crossover (blue) may prompt additional upside should the crossover develop further.
Key resistance levels:
- 1.3100
- 1.0327 (382.% Fibonacci)
Key support levels:
- 20-day EMA (purple)/50-day EMA (blue)
- 100-day EMA (yellow)
- 200-day SMA
IG CLIENT SENTIMENT DATA: BULLISH
IGCS shows retail traders are currently prominently SHORT on USD/CAD, with 56% of traders currently holding long positions (as of this writing). At DailyFX we typically take a contrarian view to crowd sentiment resulting in a short-term bullish bias.
| Change in | Longs | Shorts | OI |
| Daily | -10% | -2% | -5% |
| Weekly | 22% | -8% | 0% |
Contact and follow Warren on Twitter: @WVenketas