.jpg)

EUR/USD ANALYSIS
- Russian sanctions weigh on Euro.
- EU GDP and inflation in focus next week.
- Bearish IG client sentiment.
EURO FUNDAMENTAL FORECAST: MIXED

Gazprom and its subsidiaries in several European regions were impacted by Russian sanctions this past week, adding upside pressure on EU inflation and growth forecasts. This does not bode well for the Euro despite hawkish comments from several ECB officials. Money markets are currently pricing in roughly 85bps of cumulative rate hikes by the ECB for 2022 which could be the reason why we have not seen much in the way of Euro strength via hawkish ECB statements.
Next week’s economic calendar holds some key EU data including CPI and GDP prints. GDP is forecasted lower QoQ, and may mimic the poor showing from the UK growth figures leading to sustained downward pressure for the EUR/USD pair.
EUR/USD ECONOMIC CALENDAR
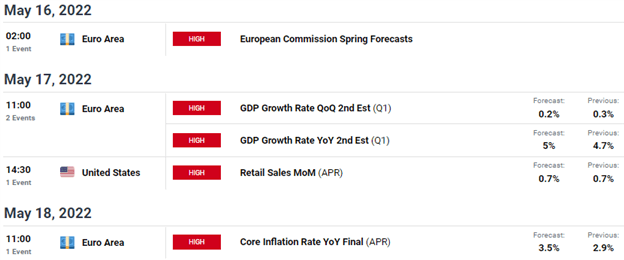
Source: DailyFX Economic Calendar

TECHNICAL ANALYSIS
EUR/USD DAILY CHART
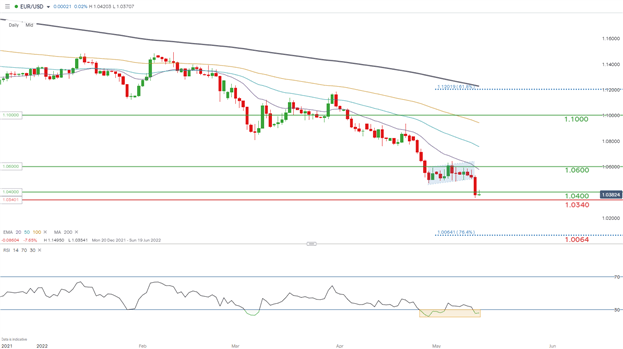
Chart prepared by Warren Venketas, IG
Price action on the daily EUR/USD chart shows Thursdays break below what appears to be a bear flag support (blue) and subsequently the 1.0400 psychological level. This now brings into question the 1.0340 2017 swing low as the next port of call for bears. A push through this key area on inflection could bring the 1.0000 parity zone into consideration and I do not see much defiance to this belief in the weeks to come.
Short-term, there is bullish divergence apparent with the RSI (yellow) showing slowing bearish momentum while EUR/USD prices push lower. Traditionally, this points to looming upside but timing can be difficult to predict. I do think the dollar rally is due for a marginal pullback before resuming the prior trend.
Resistance levels:
- 1.0600/20-day EMA (purple)
- 1.0400
Support levels:
- 1.0340 – 2017 swing low
- 1.0064 (76.4% Fibonacci)
IG CLIENT SENTIMENT DATA: BEARISH
IGCS shows retail traders are currently LONG on EUR/USD, with 76% of traders currently holding long positions (as of this writing). At DailyFX we typically take a contrarian view to crowd sentiment resulting in a downside bias.
| Change in | Longs | Shorts | OI |
| Daily | 1% | 1% | 1% |
| Weekly | -12% | 17% | -4% |
Contact and follow Warren on Twitter: @WVenketas