


US STOCKS OUTLOOK:
- The S&P 500, Nasdaq 100 and Dow all suffered steep losses on Thursday, erasing all of the previous session's gains
- Rising U.S. Treasury yields and fears of stagflation appear to be partly responsible for the brutal sell-off on Wall Street
- Friday’s non-farm payroll data may become the next big catalyst for the market
Trade Smarter - Sign up for the DailyFX Newsletter
Receive timely and compelling market commentary from the DailyFX team
Most Read: S&P 500, Nasdaq Slammed, Yields Shoot to Highs the Day After the Fed
The FOMC-induced relief rally on Wall Street seen on Wednesday didn't last long. On Thursday, U.S. stocks gave up all of the previous session's gains, plummeting across the board as traders rushed to take profits and sell rip on bets that the Fed will struggle to contain soaring inflationary pressures without deploying more aggressive measures.
At the closing bell, the S&P 500 sank 3.56% to 4,146, dragged lower by a major pullback in all mega-caps. The Dow Jones also registered heavy losses, down 3.12 % to 32,997, with all its components finishing regular trading hours in negative territory. Meanwhile, the Nasdaq 100 plunged 5.06% to 12,850, suffering the largest one-day percentage drop since September 2020 amid a monumental rout in the technology sector.
During the session, U.S. Treasury yields moved sharply higher, with the short end of the curve retracing some of yesterday’s pullback and the long end setting fresh near-term highs. The 10-year, for instance, shot up to 3.07%, its highest level since November 2018. This may be a sign that the bond market is questioning the Fed’s assessment of the economy and trying to front-run future policy actions, unpersuaded by the argument that the current tightening roadmap will be sufficient to restore price stability or that inflation is flattening out.

With Fed jitters on the rise again, fears of a hard landing for the US economy, softening corporate earnings and increasingly unpredictable levels of volatility, risk appetite will struggle to rebound in any meaningful way. This current environment may prevent a sustained recovery in the equity space until incoming economic data begins to paint a different picture of the broader outlook.
Focusing on the calendar, investors will have the opportunity to evaluate the health of the labor market, and wage pressures on Friday when the U.S. BLS releases its April employment report. According to consensus forecasts, the economy added 391,000 jobs last month, a moderate decline from the 431,000-increase in March. However, the headline print is likely to disappoint expectations, as several ISM surveys released earlier this week point to a sharp slowdown in hiring.
Traders should also watch April average hourly earnings, which are seen rising 0.4% month-over-month and 5.5% year-on-year. From the stock market’s point of view, strong job gains coupled with moderating wage growth would be the sweet spot that could help calm some nerves. Conversely, if hiring cools markedly and wages rise at an aggressive rate, equities could lose more ground in the near term on stagflation concerns.

S&P 500 TECHNICAL ANALYSIS
Wednesday's stock market rally fueled optimism that the S&P 500 would stabilize and begin a sustained recovery, but upbeat expectations were dashed after Thursday's massive sell-off. Looking at the daily chart, we can see that the index dropped so violently that it sliced two key floors and closed below the 4,160 area. With the bears firmly entrenched in the driver’s seat, a retest of the 2022 lows looks increasingly likely. This technical support must hold, otherwise selling pressure could intensify, paving the way for a drop towards 3,850.
On the flip side, if the S&P 500 defies expectations and begins to rebound, initial resistance appears at 4,160 and 4,225/4,230 thereafter. On further strength, the focus shifts up to the 4,300 psychological level, followed by 4,350, the 38.2% Fibonacci retracement of the 2022 decline.
S&P 500 TECHNICAL CHART
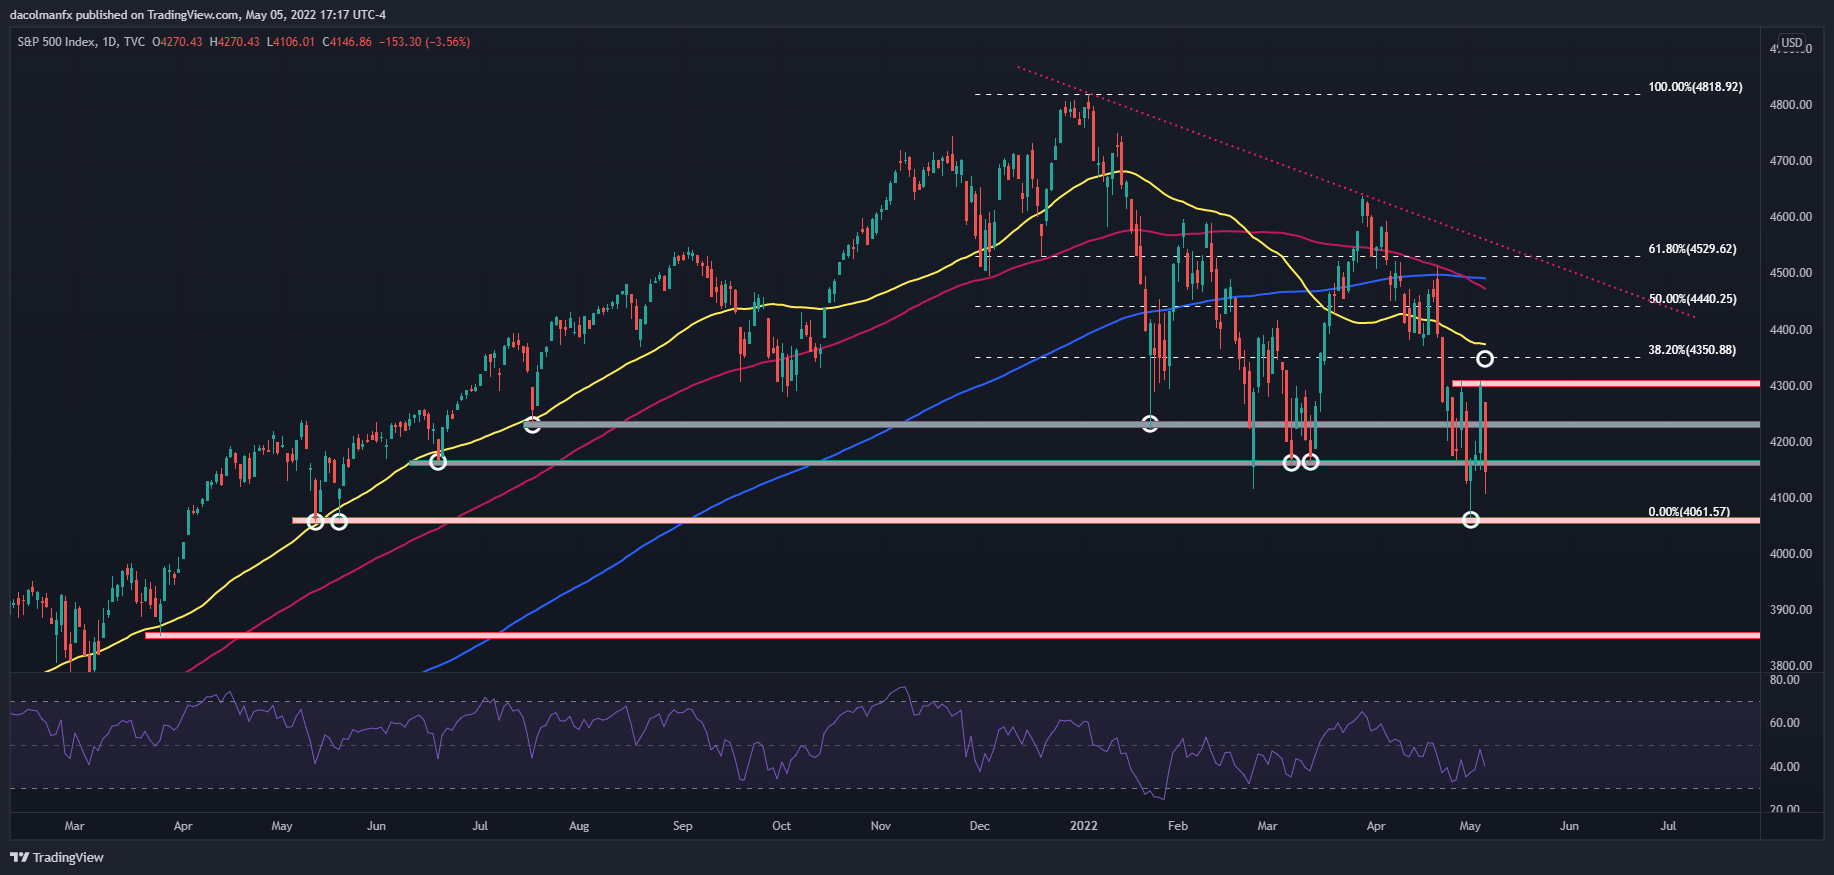
S&P 500 Chart Created Using TradingView
EDUCATION TOOLS FOR TRADERS
- Are you just getting started? Download the beginners’ guide for FX traders
- Would you like to know more about your trading personality? Take the DailyFX quiz and find out
- IG's client positioning data provides valuable information on market sentiment. Get your free guide on how to use this powerful trading indicator here.
---Written by Diego Colman, Market Strategist & Contributor


