


Japanese Yen, USD/JPY, US Dollar, IMF,Crude Oil, Fed, BoJ - Talking Points
- The Japanese Yen has had verbal intervention but is yet to face physical action
- The Fed and Bank of Japan have opposite agendas, a change appears unlikely
- Yield curve control makes intervention difficult. Will USD/JPY uptrend continue?
Trade Smarter - Sign up for the DailyFX Newsletter
Receive timely and compelling market commentary from the DailyFX team
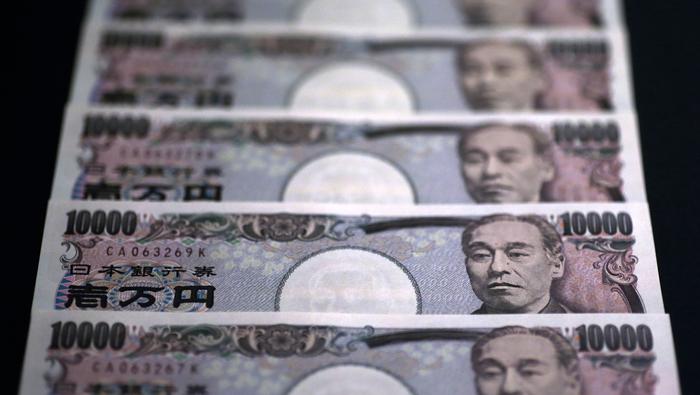
The Japanese Yen continued to weaken again today as speculation of potential intervention sweeps markets. Problematic for such action is the underlying fundamentals.
The Bank of Japan (BoJ) today re-iterated their stance of maintaining yield curve control and offered to buy an unlimited amount of bonds to implement their loose monetary policy. The benchmark 10-year Japanese government bond (JGB) is yielding under 0.25%
Officials from the BoJ and Japan’s Ministry of Finance (MoF) continued with the jawboning around concern for Yen weakness, but to little avail.
On the flip side, Chicago Federal Reserve Bank President Charles Evans picked up the hawkish baton and said that he could see 9 hikes by the end of this year. With 6 meetings left, that implies 3 hikes of 50 basis points.
The 10-year Treasury note is yielding a few basis points below 3%. The short end of the curve is a similar picture with US-Japan policy disparity just as evident.
All of this makes intervention an uphill battle for now. At the very least, it seems that any successful intervention would need to be a co-ordinated one between several central banks.
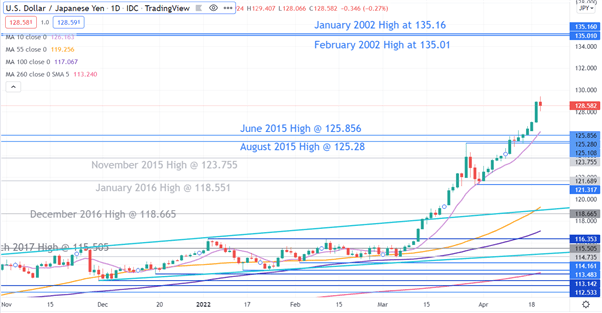
In 6-weeks, USD/JPY has gone from 115 to a high overnight of 129.41. At the time of going to print, it is below 129 again.
The US Dollar is generally lower today, while the Australian Dollar has led the commodity bloc of CAD, NOK and NZD to firmer ground.
US equities had a positive cash session but futures contracts tracking major US stock market benchmarks – the Dow, S&P 500 and Nasdaq – are now pointing to small losses on the open.
Netflix reported after the bell and disappointed expectations, with 200k less subscribers for the first quarter.
APAC equities are in the green through the Asian session, with the exception of mainland China. The PBOC left rates unchanged when the market had been looking for a cut in the face of increasing Covid-19 related lockdowns. The 1- and 5-year prime loan rate remains at 3.7% and 4.6% respectively.
The International Monetary Fund (IMF) cut global growth forecasts for 2022 to 3.6%, instead of the 4.4% previously expected overnight. This sent crude oil over 5.5% lower in the North American session, but it has recovered around 1% in Asia.
Later today, the market will be eyeing the Energy Information Administration’s (EIA) crude oil inventory report for clues on the balance between supply and demand.
The Fed’s Beige book will also be released as well as Canadian CPI.
The full economic calendar can be viewed here.

USD/JPY Technical Analysis
A move below the 10-day simple moving average (SMA),Ucurrently at 126.16, could be a signal that USD/JPY bullish momentum might be fading.
For now, all short, medium and long-term SMAs display positive gradients and are arranged in order of their tenures. The price is above all SMAs and the shorter term SMAs are above any SMA of longer day duration.
Support could be at historical pivot points of 125.86 and 125.28. On the upside, there appears to be a bit of ‘free air’ until the 2002 twin peaks of 135.02 and 135.16.
--- Written by Daniel McCarthy, Strategist for DailyFX.com
To contact Daniel, use the comments section below or @DanMcCathyFX on Twitter


