


Nasdaq 100 Index, Biden Stimulus Plan, Rising Yields, Rotation Trade, Corporate Tax – Talking Points:
- Equity markets traded cautiously lower during APAC trade as investors digested US fiscal aid plans.
- Rising bond yields and tax hike fears may weigh on US equity markets in the near term.
- Nasdaq 100 index at risk of further losses as prices begin to probe key uptrend support.
Asia-Pacific Recap
Equity markets traded cautiously lower during Asia-Pacific trade as investors digest President-elect Joe Biden’s proposed $1.9 trillion stimulus package and how it ultimately passes through the Senate. Australia’s ASX 200 index remained unchanged on the day while Japan’s Nikkei 225 slipped 0.62%.
In FX markets, the haven-associated US Dollar and Japanese Yen gained ground against their major counterparts, while the cyclically-sensitive Australian Dollar and Norwegian Krone largely outperformed. Gold prices crept higher as US 10-year Treasury yields drifted 3 basis points lower, while WTI crude oil fell 1.18%.
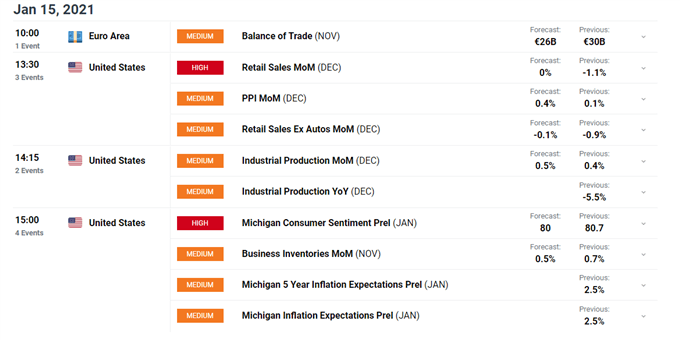
Looking ahead, Euro-zone trade balance data for the month of November headlines the economic docket alongside US retail sales and industrial production numbers for December.
Rising Bond Yields, Tax Hike Fears Weighing on Tech-Heavy Nasdaq
The announcement of President-elect Joe Biden’s proposed $1.9 trillion stimulus package appears to have taken the wind out of the tech-heavy Nasdaq 100 index’s sails, at least in the near term.
The index has slid just under 2% lower after storming to fresh record highs on January 8, as the prospect of additional fiscal spending sends bond yields higher and fuels a rotation from technology to growth stocks.
Biden’s aid bill calls for an additional $1400 per-person in direct payments to the vast majority of households, enhanced unemployment benefits, funding for state and local governments, and increased spending to assist coronavirus vaccine distribution.
Nasdaq 100/Russell 2000 Ratio

Nasdaq 100 / Russell 2000 ratio daily chart created using Tradingview
The suggestion of tax hikes from the President-elect has also contributed to the Nasdaq’s recent move lower, as Biden reiterated that “where we are making permanent investments, as I said on the campaign, we will pay for them by making sure that everyone pays their fair share in taxes”. He plans to do this by “closing tax loopholes for companies that ship American jobs overseas or that allow American companies to pay zero in federal income taxes”.
However, the ability of Senate Republicans to filibuster the Biden administration’s agenda could prevent these legislative proposals from being adopted. That being said, Democrats could use the process of budget reconciliation to pass tax and fiscal matters on a simple majority basis. This means that if all 50 Democrats in the Senate remain united, Vice President-elect Kamala Harris could cast the tiebreaking vote.
Therefore, the prospect of increased taxation, and climbing bond yields, may limit the Nasdaq 100’s upside in near term.
Nasdaq 100 Index Futures Daily Chart – Challenging 10-Month Uptrend Support
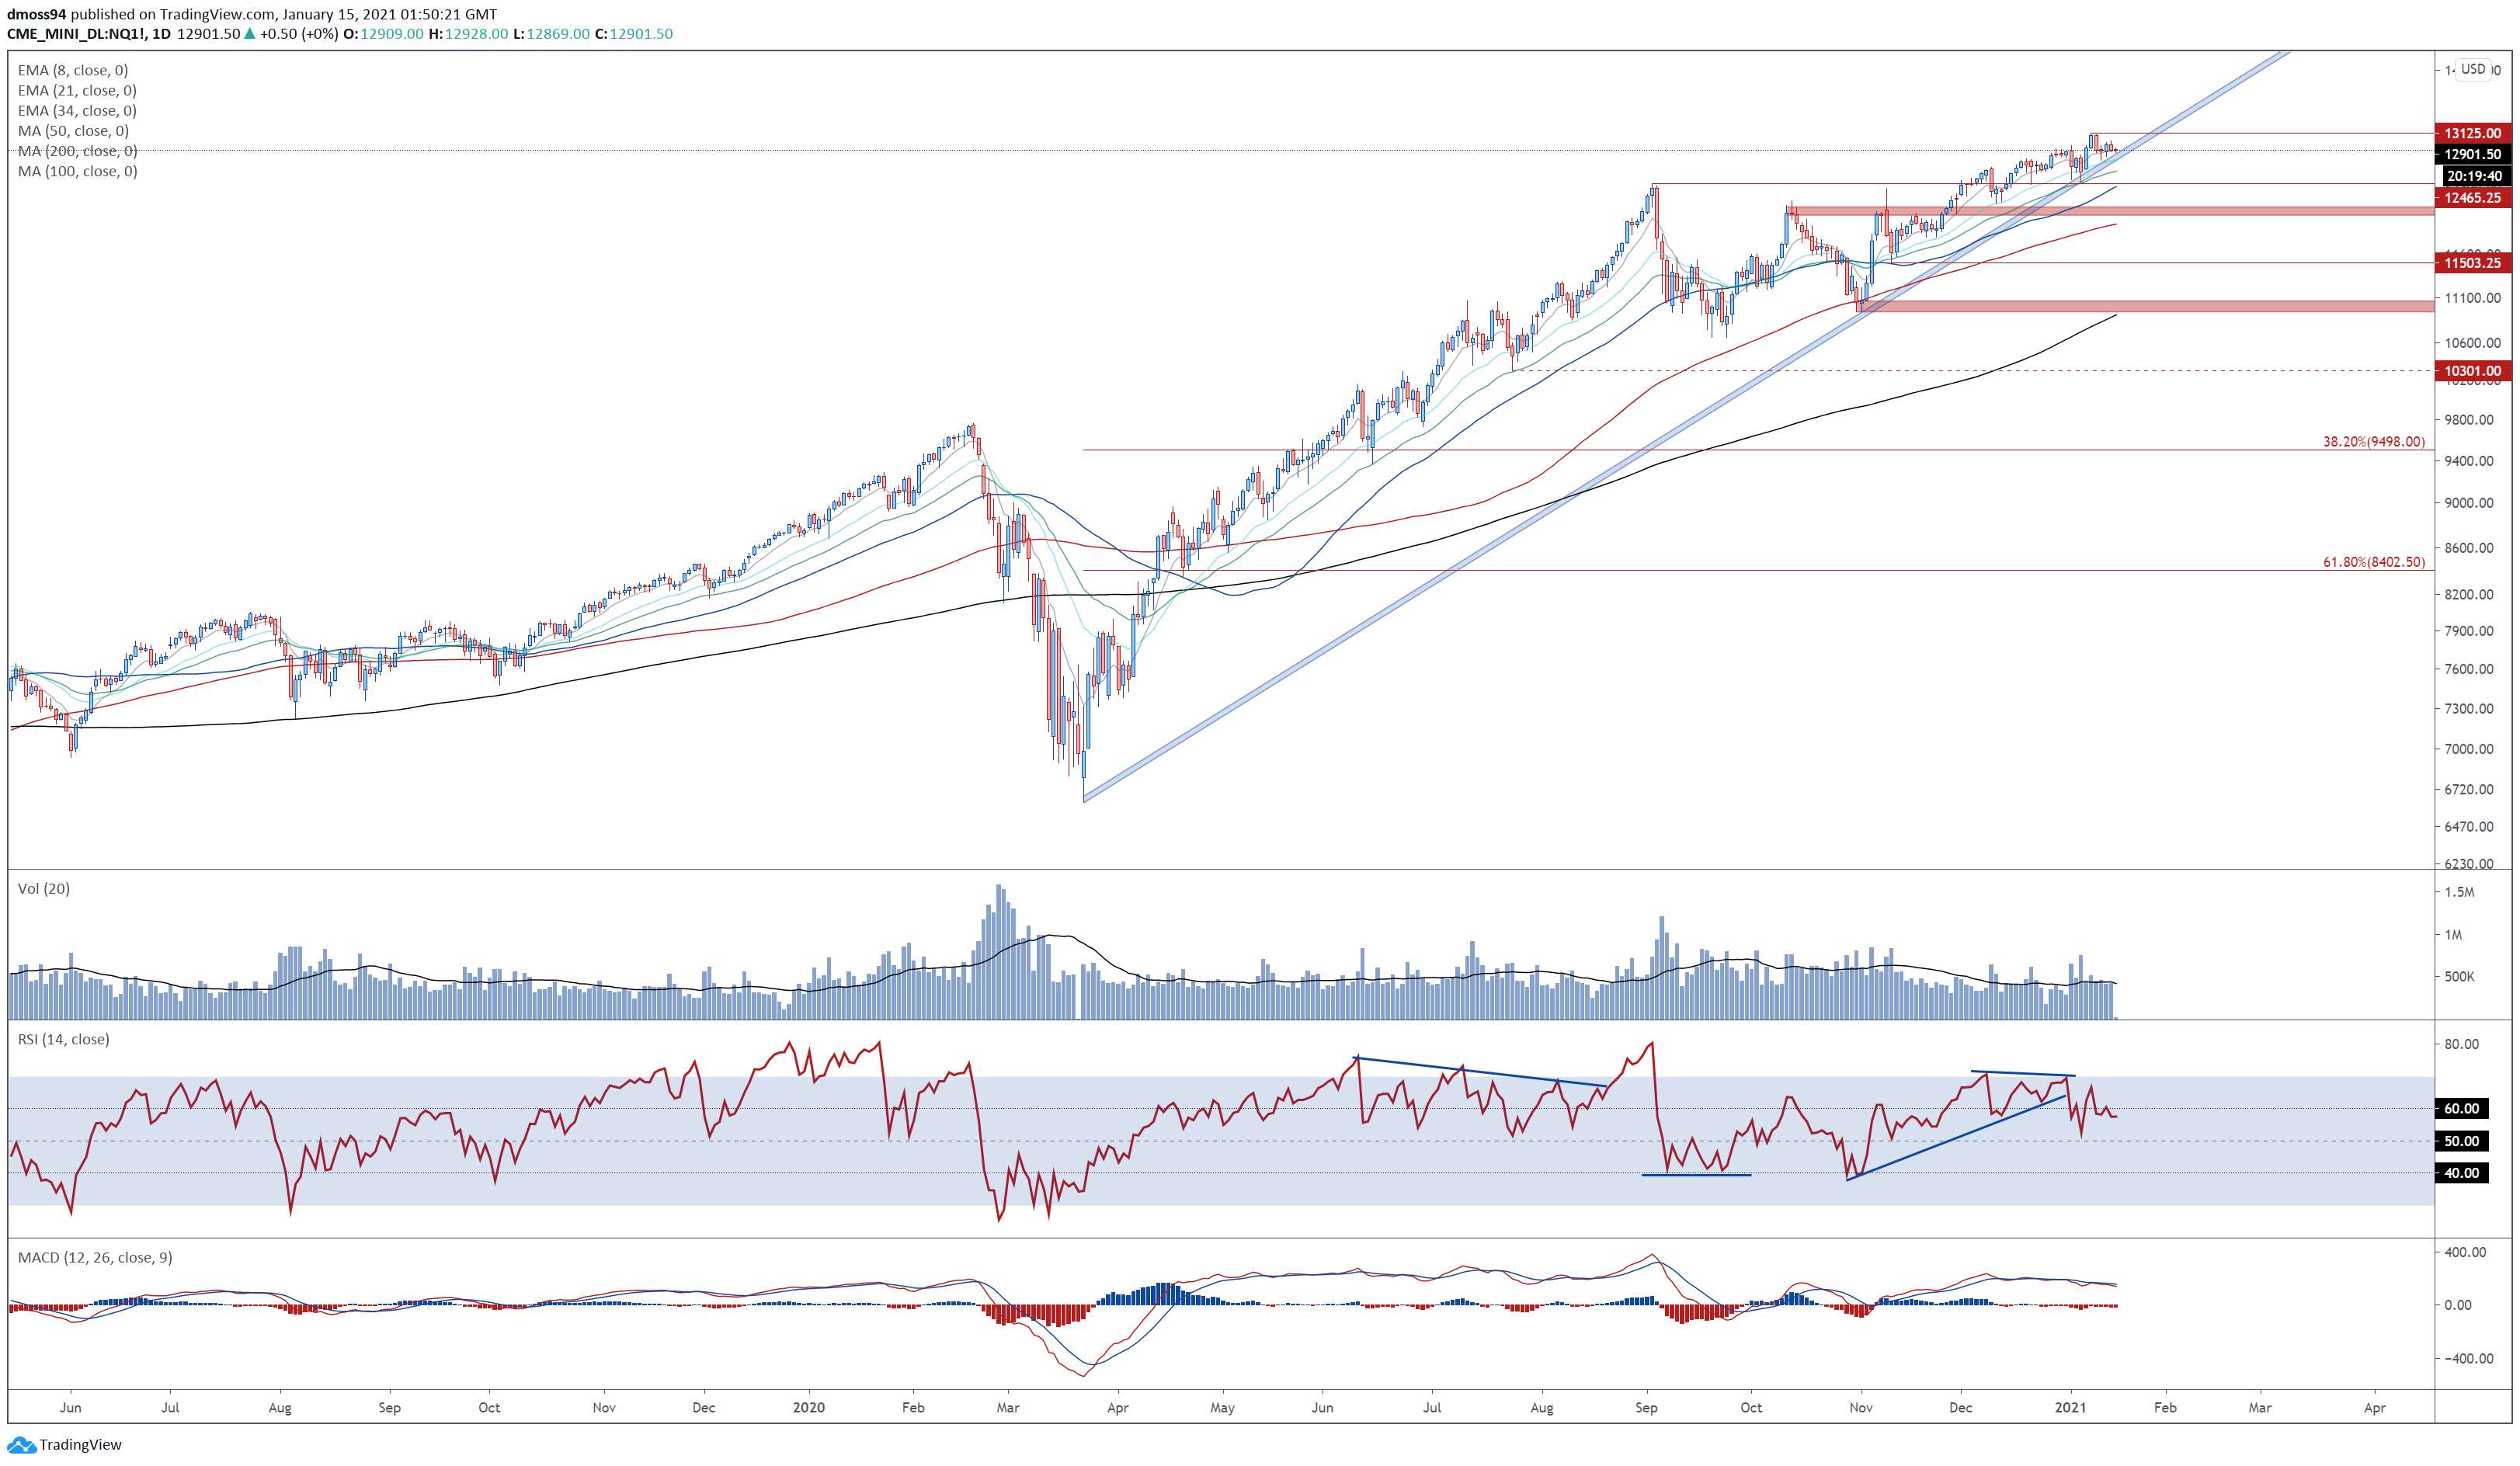
Nasdaq 100 index futures daily chart created using Tradingview
From a technical perspective, the Nasdaq 100 may extend its recent slide from the yearly high (13125), as price begins to challenge key uptrend support extending from the March 2020 low (6629).
With the RSI sliding back towards its neutral midpoint, and a bearish crossover taking place on the MACD indicator, further losses could be in the offing.
A daily close below the 21-day exponential moving average (12771) would probably signal the break of 10-month uptrend support and trigger a pullback towards confluent support at the monthly low (12491) and trend-defining 50-MA.
Conversely, a retest of the January high (13125) may be on the cards if uptrend support remains intact.
Nasdaq 100 Index Futures 4-Hour Chart – RSI Hints at Swelling Bearish Momentum

Nasdaq 100 index futures 4-hour chart created using Tradingview
Jumping into the four-hour chart also hints at the potential for further losses, as sellers drive price back below the 12900 mark and 50-MA (12873).
A convincing break below the January 12 low (12767) would likely intensify selling pressure in the near term and carve a path for price to challenge the monthly low (12491).
Alternatively, remaining constructively perched above the 100-MA (12827) would probably inspire a rebound back towards psychological resistance at 13000.
-- Written by Daniel Moss, Analyst for DailyFX
Follow me on Twitter @DanielGMoss


