


S&P 500, Dow Jones, US Fiscal Stimulus Talks, Coronavirus Hospitalizations – Talking Points:
- Equity markets lost ground during APAC trade as the deadlock in US stimulus talks soured market sentiment.
- Tightening coronavirus restrictions and the absence of a much-needed aid package may weigh on US benchmark equity indices.
- S&P 500 at risk of a more extended pullback as price fails to breach key resistance.
- Dow Jones also at risk as prices carve out a bearish Rising Wedge pattern.
Asia-Pacific Recap
Asian equity markets slid lower during Asia-Pacific trade as the deadlock in US fiscal stimulus negotiations notably soured market sentiment.
Australia’s ASX 200 index fell 0.67% as Beijing announced it would impose fresh import duties on Australian wine from December 11, while Japan’s Nikkei 225 index retreated 0.21%.
In FX markets, the cyclically-sensitive AUD, NZD and NOK largely outperformed their major counterparts, while the haven-associated USD and JPY lost ground.
Gold and silver recovered lost ground after plunging lower yesterday, as yields on US 10-year Treasuries dipped 1 basis point to 0.93%.
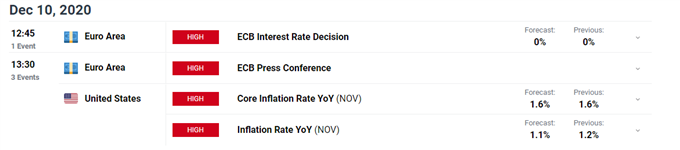
Looking ahead, the European Central Bank’s monetary policy meeting headlines the economic docket alongside US inflation and jobless claims data.
Surging Covid-19 Cases, Prolonged Stimulus Talks to Weigh on Sentiment
US benchmark indices slipped lower yesterday, as the absence of a much-needed fiscal stimulus package and a record surge in coronavirus cases notably weighed on market sentiment.
Infections have surged in the wake of the Thanksgiving holiday, with the nation recording more than 215,000 new cases on Tuesday and the number of Covid-19 patients in hospital spiking to a record 106,688.
The relentless rise in cases is threatening to upend the local economic recovery, with several states tightening restrictions in order to reduce the burden on the hospital system.

However, the deteriorating fundamental backdrop has yet to convince US policymakers to pass another relief package, as both sides of the aisle continue to clash over liability protections offered to businesses operating during the pandemic, and the provision of aid to state and local governments.
That being said, with Democrats and Republicans warming to the $908 billion proposal brought forward by a bipartisan group from the House and Senate, Treasury Secretary Steven Mnuchin has suggested that Congress drop the two unresolved issues and move forward with the rest of the agreement.
Nevertheless, with House Speaker Nancy Pelosi and Senate Minority Leader Chuck Schumer rejecting a $916 billion stimulus offer from the White House, a resolution seems relatively unlikely in the coming days.
Therefore, prolonged negotiations and tightening coronavirus restrictions may limit investor’s appetite for risk in the near term and weigh on the benchmark S&P 500 and Dow Jones indices.
Dow Jones Index Futures Daily Chart – Bearish RSI Divergence Ominous for Bulls
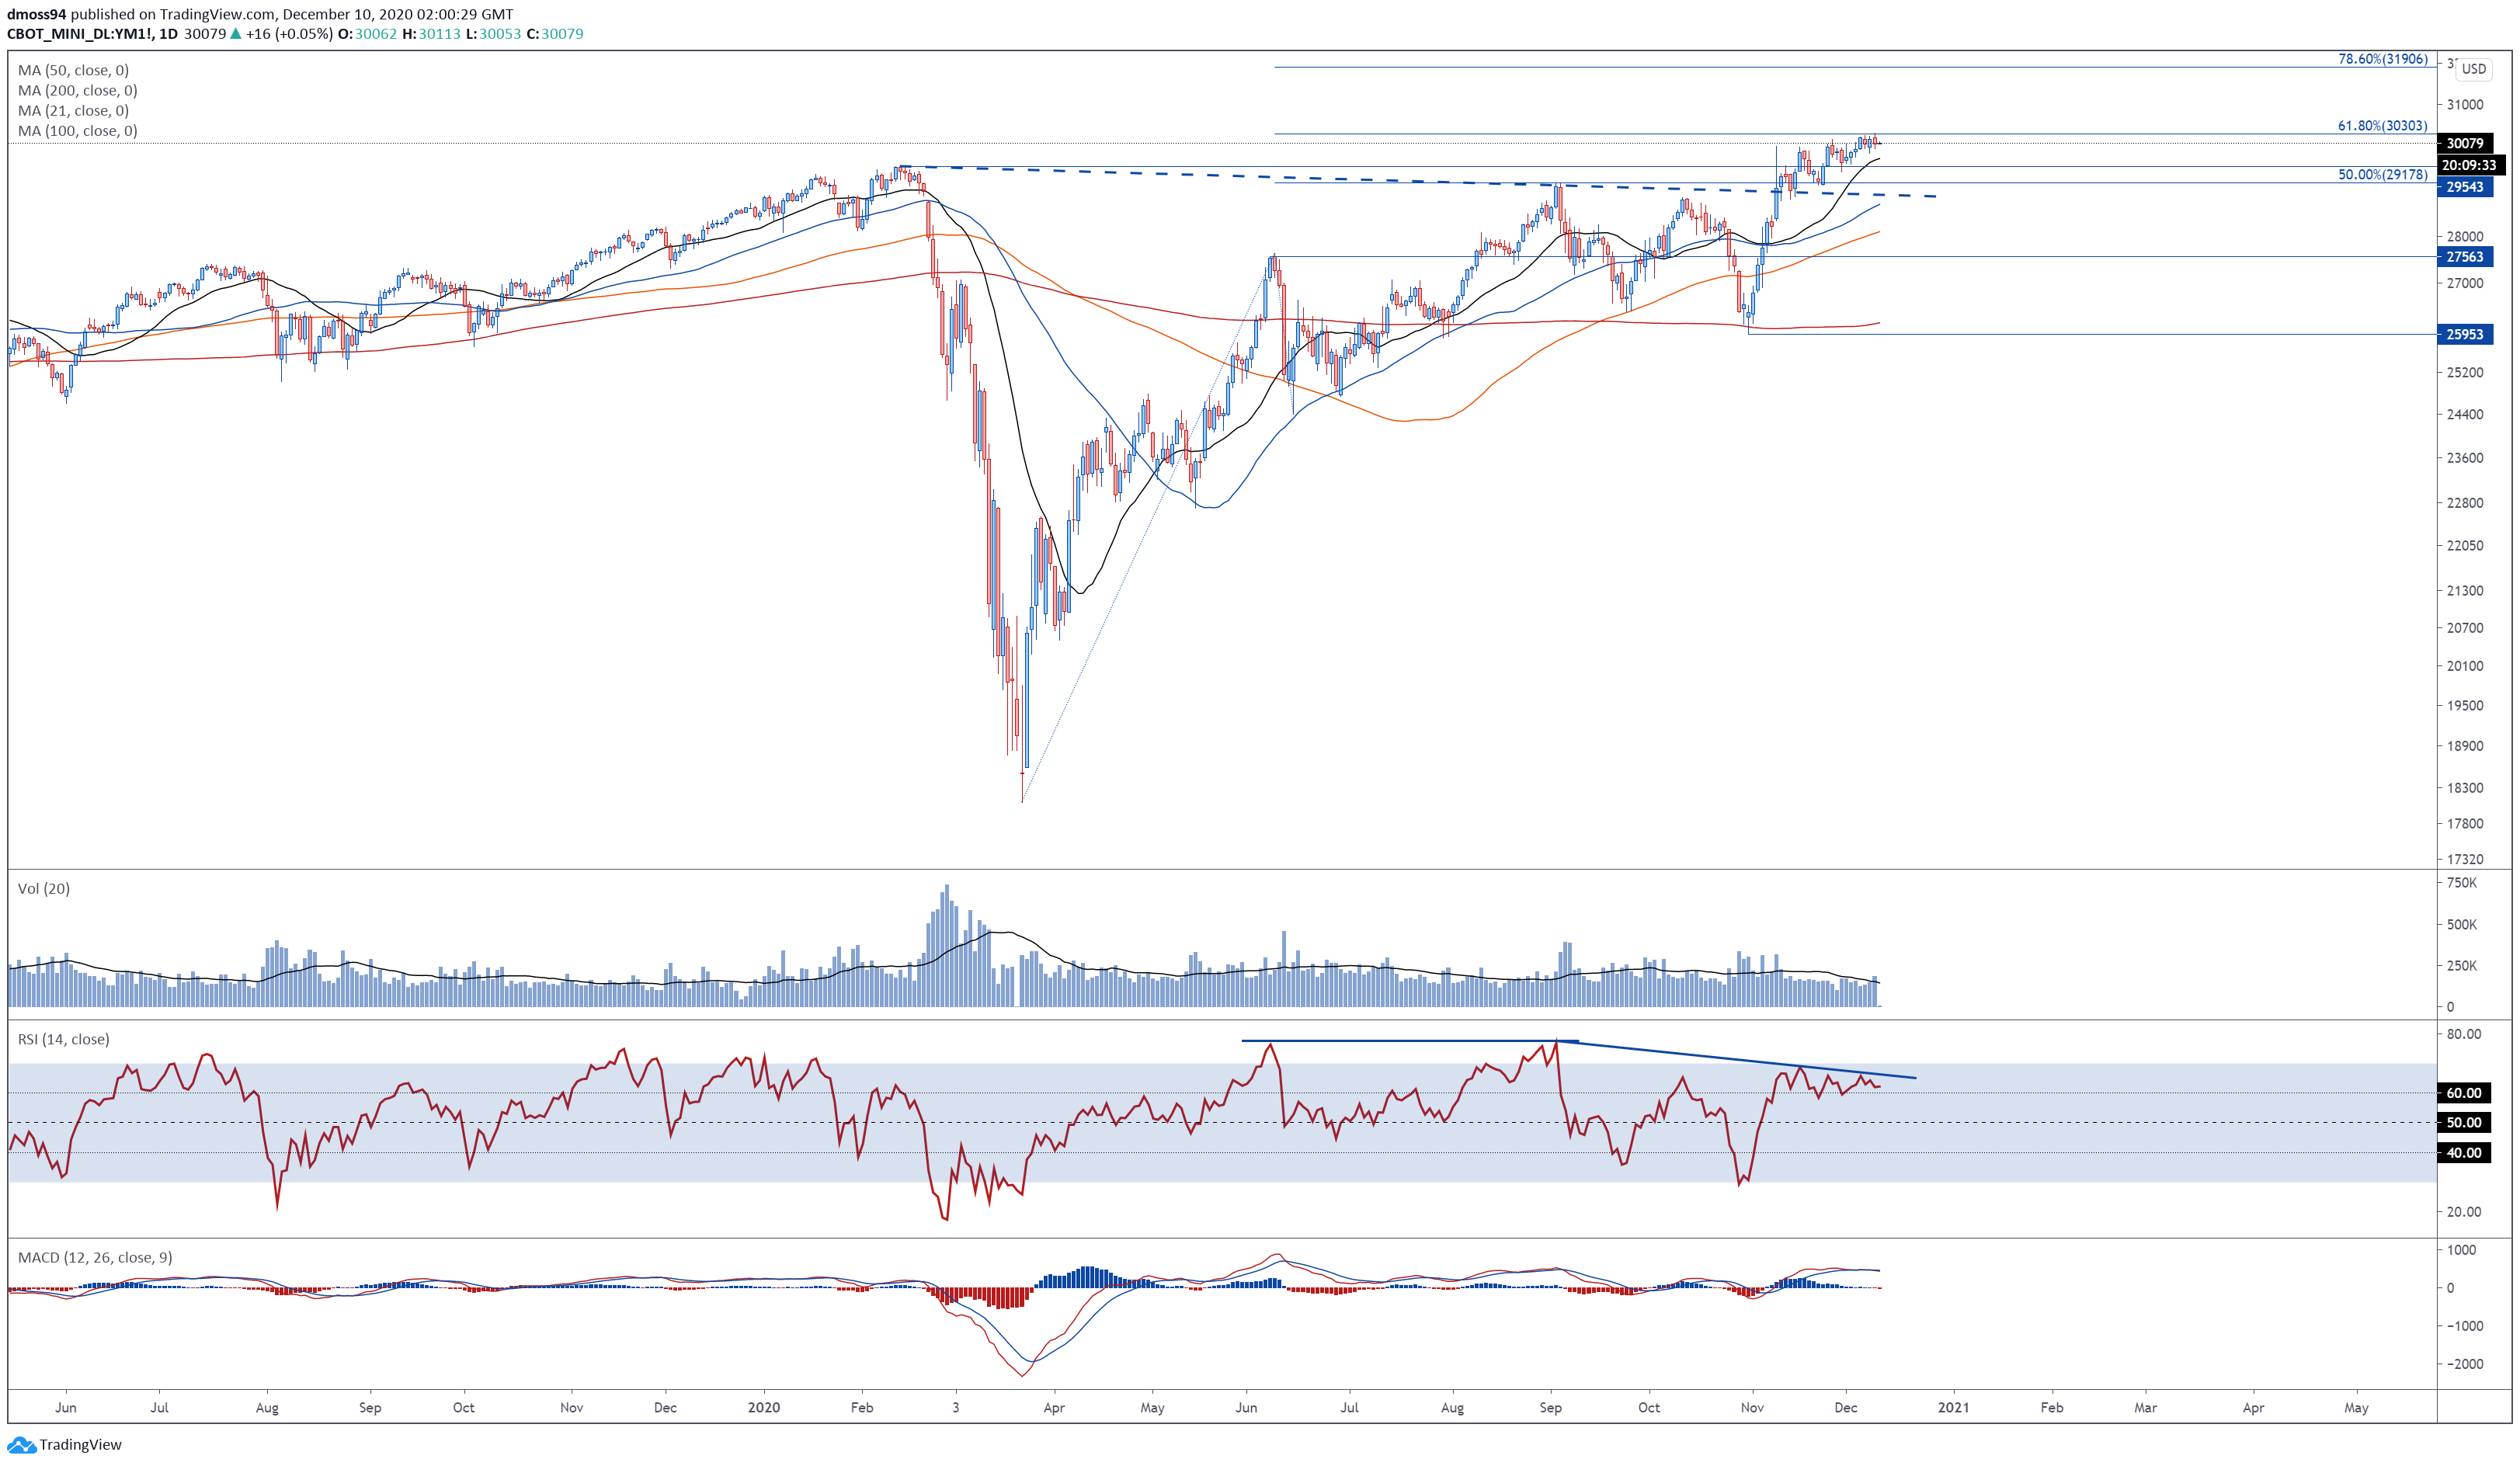
Dow Jones index futures daily chart created using Tradingview
From a technical perspective, the Dow Jones Industrial Average (DJIA) could be at risk of further losses, as price struggles to overcome key resistance at the 61.8% Fibonacci (30303).
Bearish RSI divergence, in tandem with the notable flattening of all four moving averages, suggests that the path of least resistance is skewed to the downside.
Slipping back below psychological support at 30000 could ignite a pullback towards the February high (29543). Breaching that on a daily close basis would likely bring a cluster of support levels at the 50% Fibonacci (29178) and trend-defining 50 day-moving average (28697) into focus.
Alternatively, gaining a firm foothold above 30300 may neutralize near-term selling pressure and carve a path for prices to probe the 31000 mark.
Dow Jones Index Futures 4-Hour Chart – Rising Wedge Hints at Further Losses
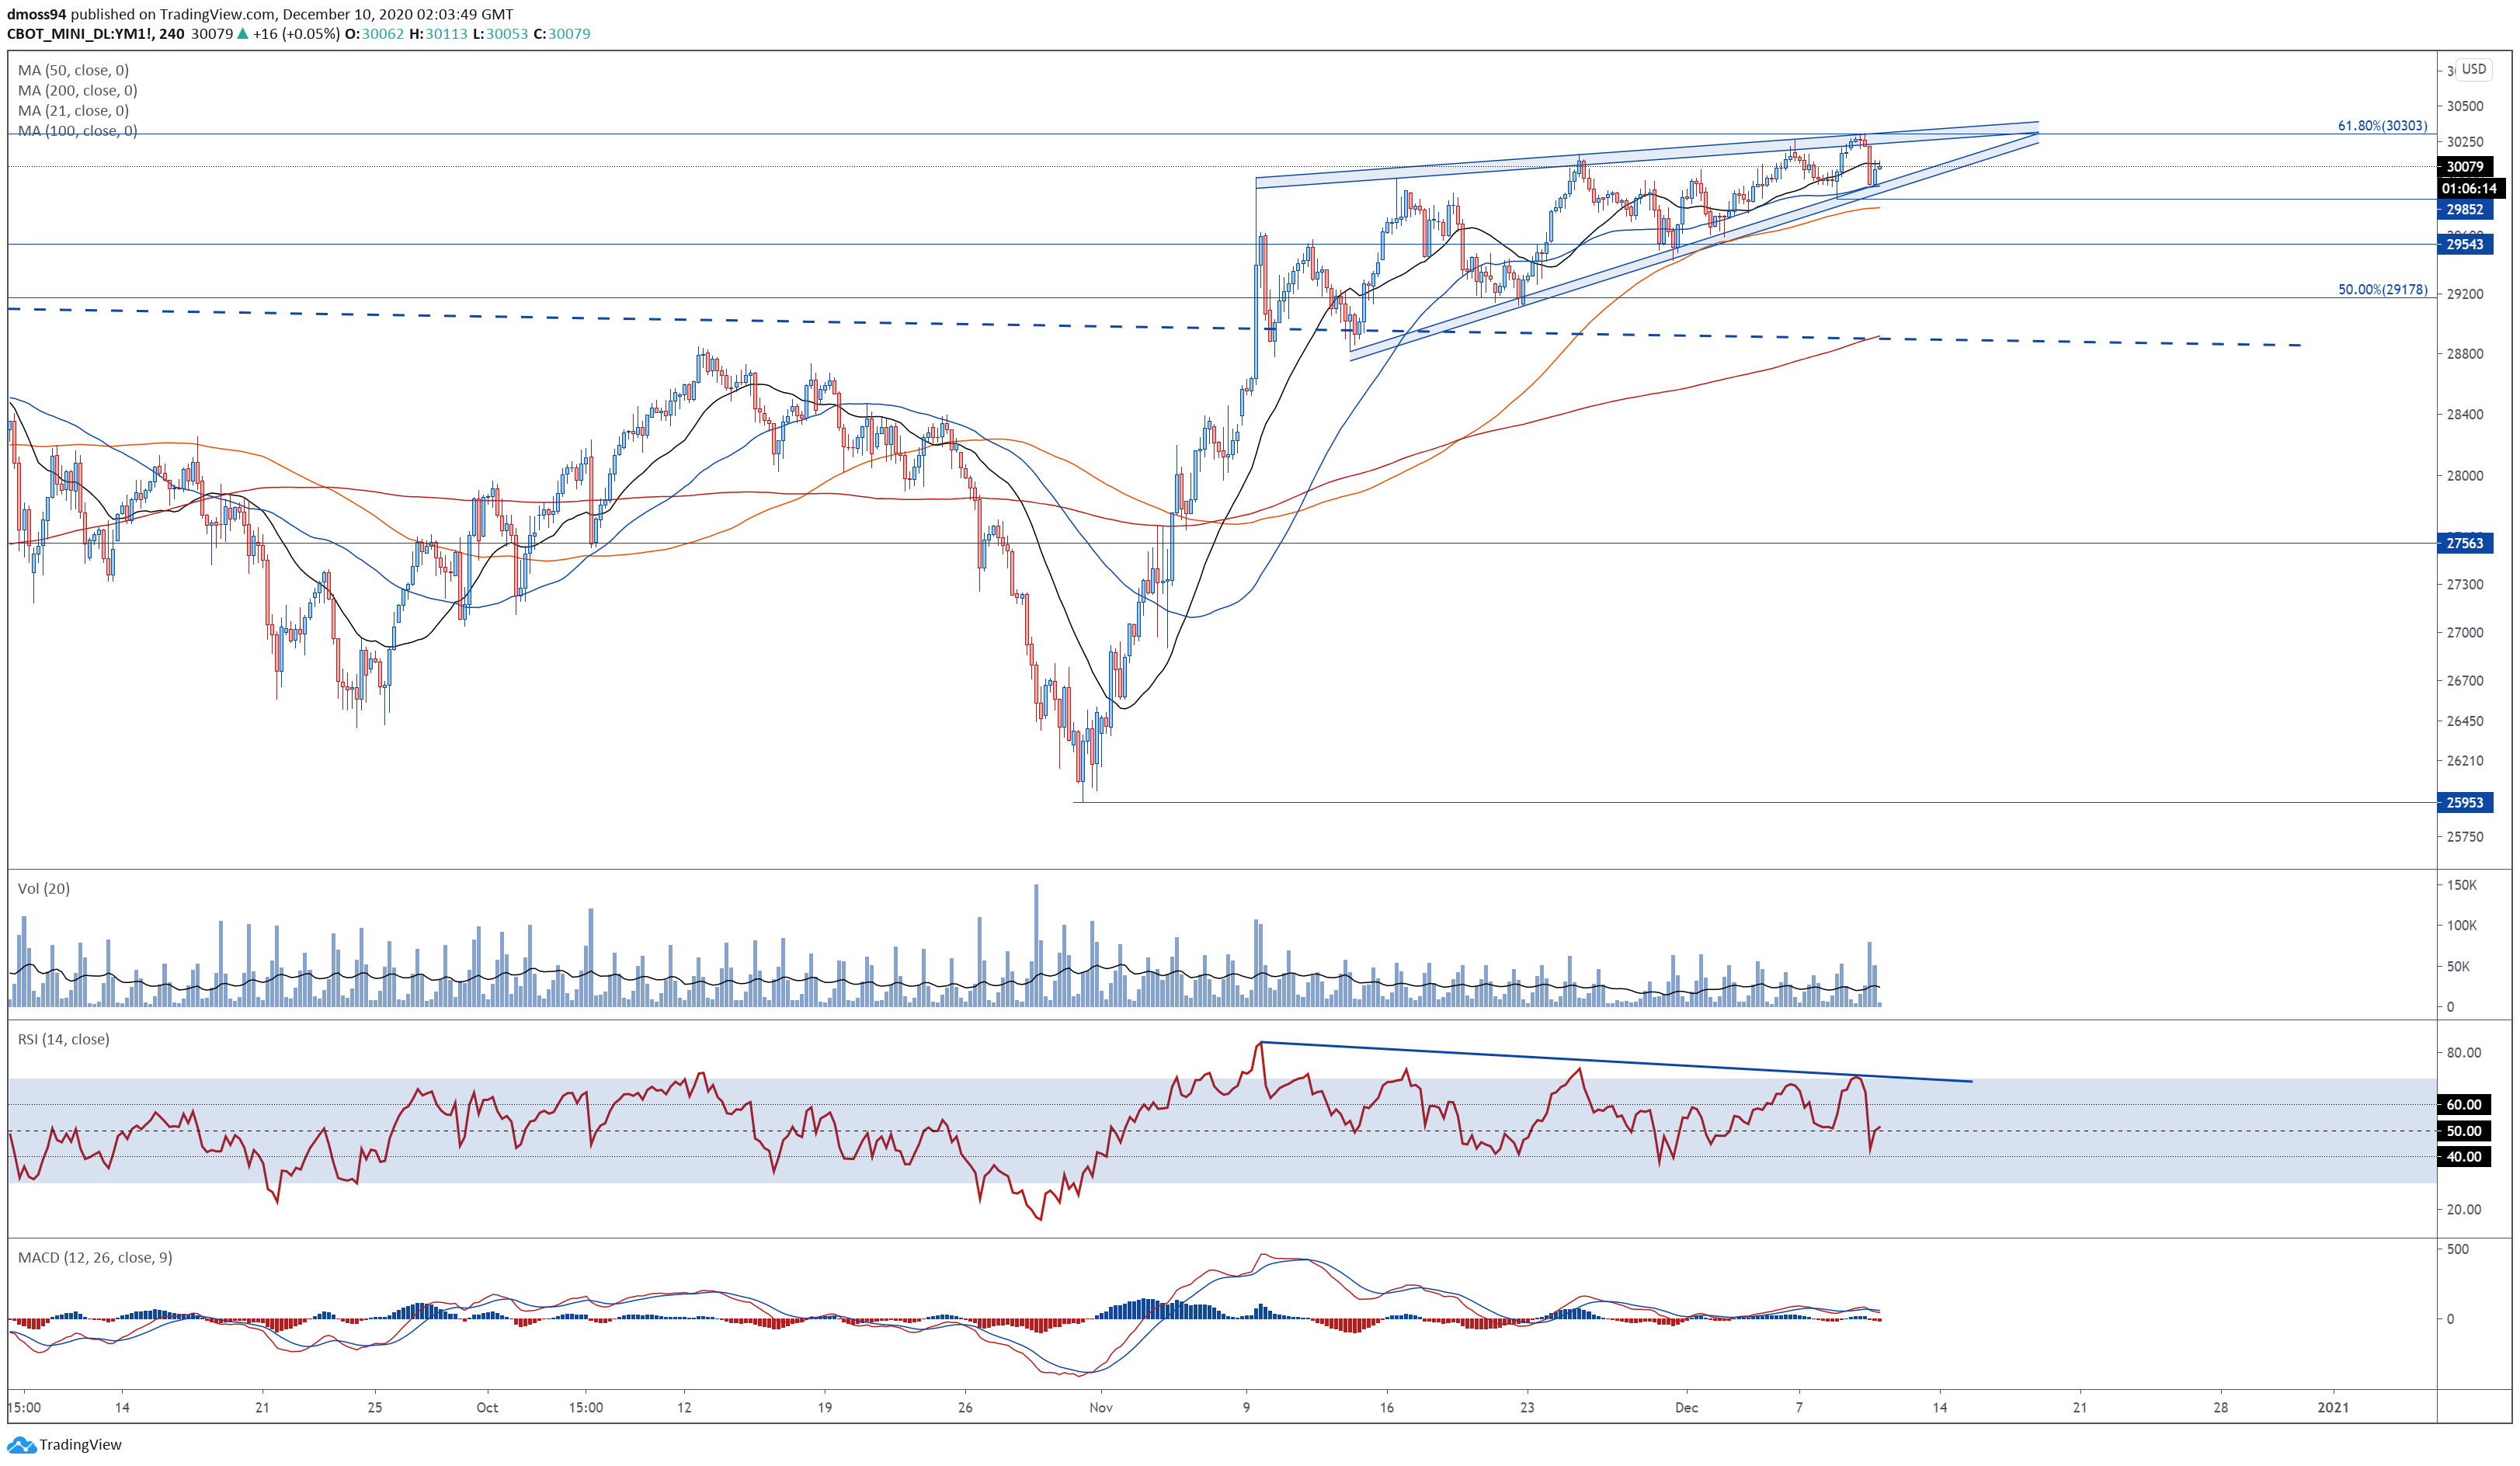
Dow Jones index futures 4-hour chart created using Tradingview
Zooming into a four hour chart also suggests that a correction lower could be on the cards, as the Dow Jones consolidates within the confines of a bearish Rising Wedge pattern.
Slicing through wedge support and the December 8 low (29852) would likely validate the downside break of the bearish pattern and generate a downside push towards the 50% Fibonacci (29178).
On the other hand, breaking above the December 9 high (30296) could signal the resumption of the primary uptrend and open the door for price to test psychological resistance at 31000.
S&P 500 Index Futures Daily Chart – Fibonacci Resistance Stifling Buying Pressure
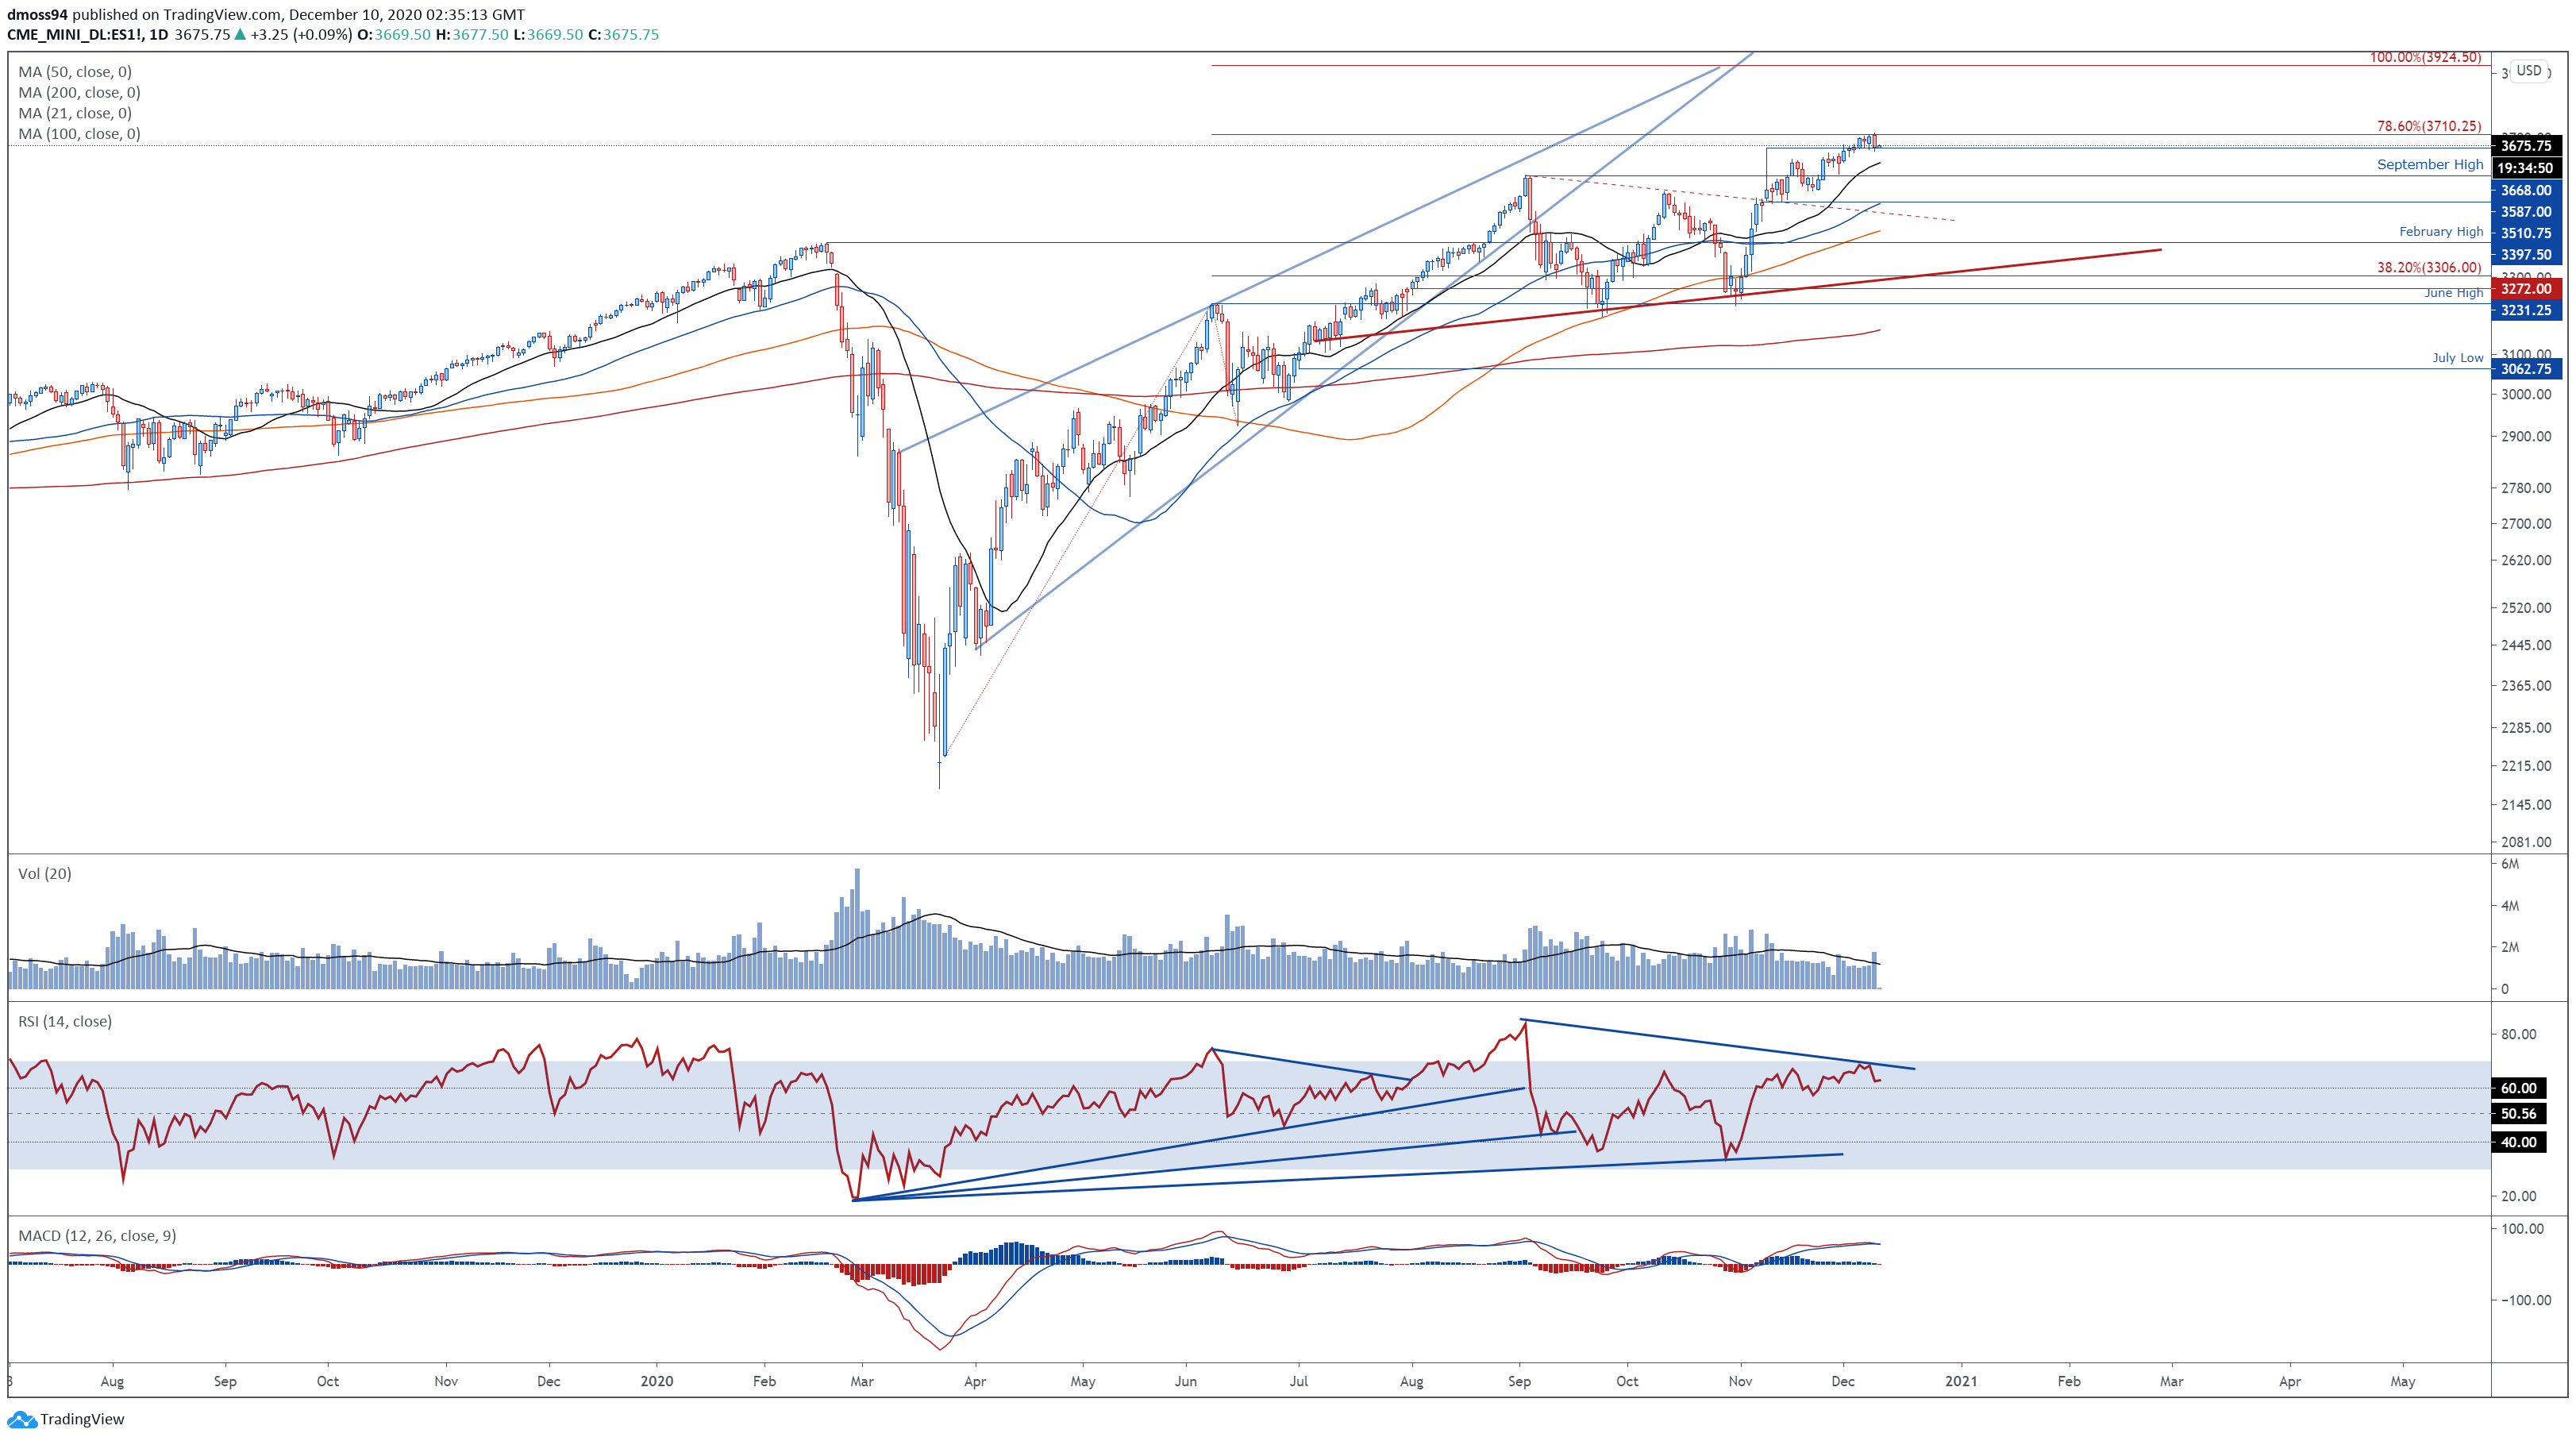
S&P 500 index futures daily chart created using Tradingview
The S&P 500 also looks at risk of further losses, as the RSI fails to confirm the recent push to higher highs and buyers fail to hurdle resistance at the 78.6% Fibonacci (3710.25).
Fading volume and a bearish MACD crossover are indicative of ebbing bullish momentum and suggests that a more extended correction lower could be on the cards.
A daily close back below the November high (3668) would probably intensify selling pressure and propel price back towards psychological support at 3600, with a break below bringing confluent support at the 50-day moving average and November 9 low (3516).
Conversely, penetrating the 78.6% Fibonacci could encourage would-be buyers and open the door for price to challenge the psychological resistance at 3800.
S&P 500 Index Futures 4-Hour Chart – Rising Wedge in Play
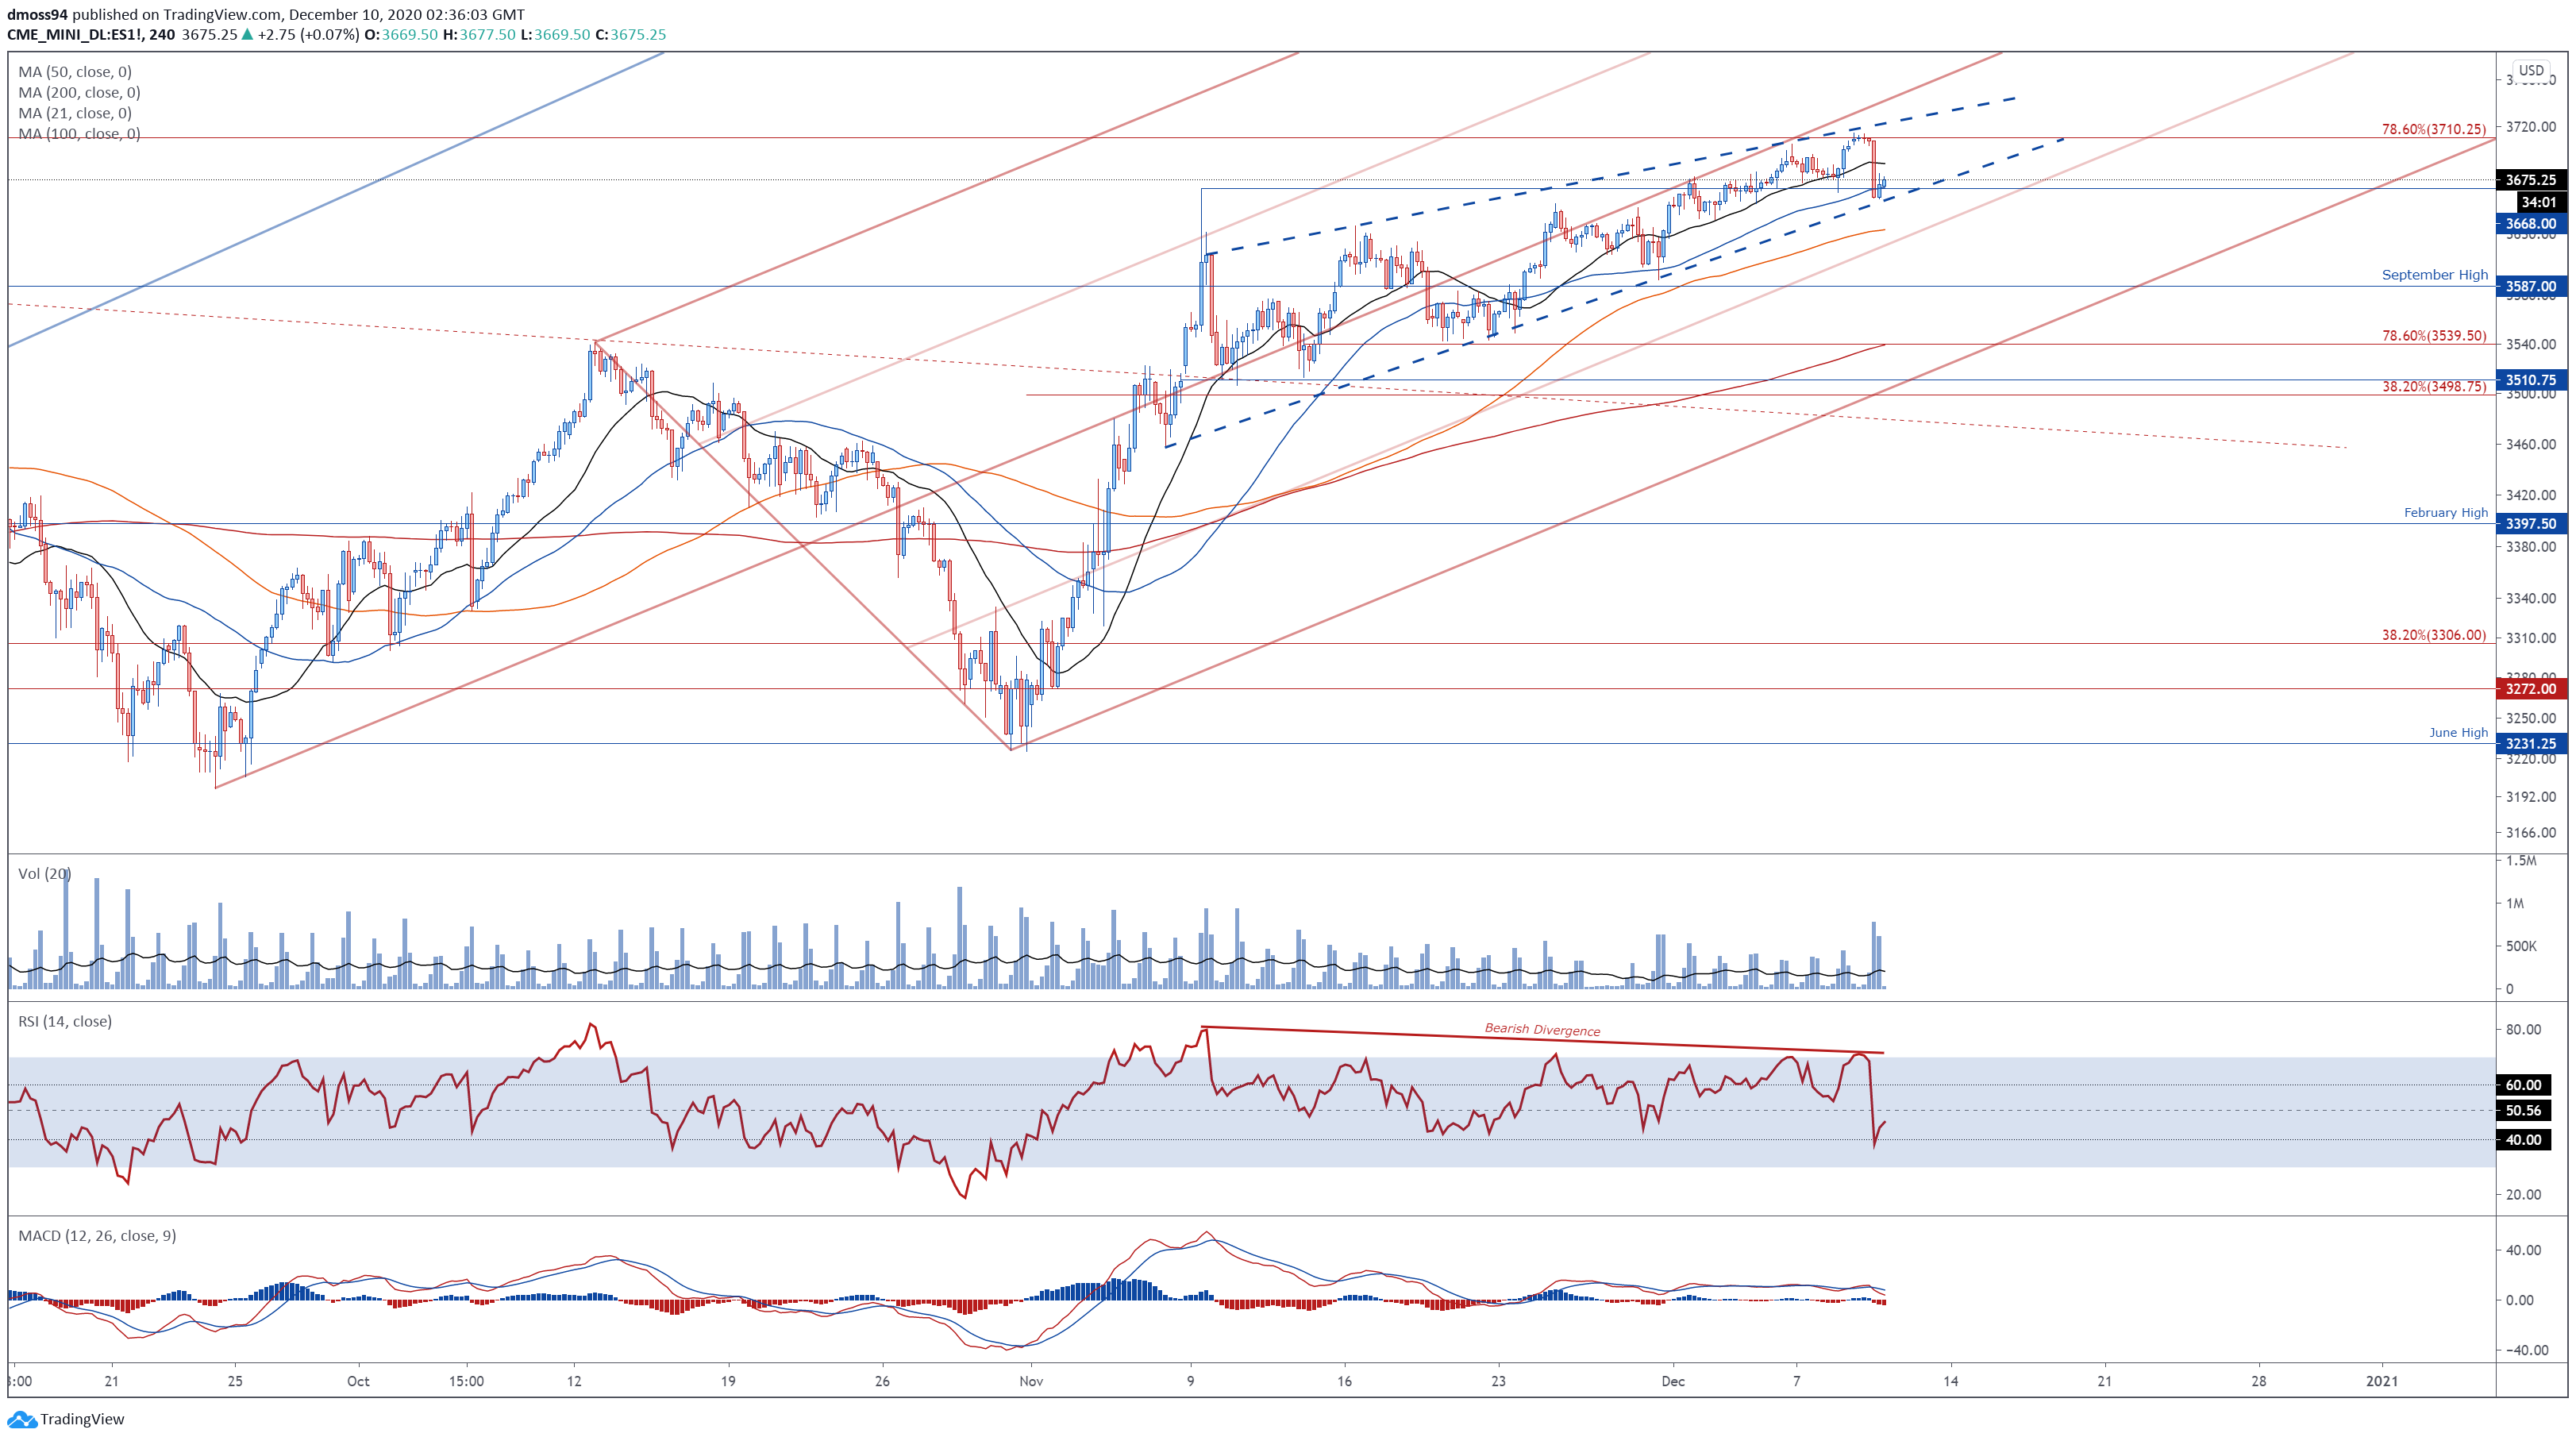
S&P 500 index futures 4-hour chart created using Tradingview
Scrolling into the four-hour chart reinforces the prospect of a short-term pullback, as price carves out a Rising Wedge pattern.
Snapping back below 3650 may intensify selling pressure and drive price back towards the September high (3587). Breaking that would probably bring the sentiment-defining 200-MA and 78.6% Fibonacci (3539) into the crosshairs.
On the contrary, bursting above the December high (3714) could allow buyers to regain control and drive price towards psychological resistance at 3800.
-- Written by Daniel Moss, Analyst for DailyFX
Follow me on Twitter @DanielGMoss


