


IBEX 35, CAC 40, European Covid-19 Second Wave, Coronavirus Lockdowns – Talking Points:
- Asian equity markets ended the day broadly in the red as tightening restrictions throughout Europe gnawed at market sentiment.
- National lockdowns in France and Spain may drastically undermine regional risk-associated assets.
- Spain’s IBEX 35 index guided lower by Descending Channel pattern.
- RSI oversold readings hint at extended losses for France’s CAC 40 index.
Asia-Pacific Recap
Asian equity markets sank lower during Asia-Pacific trade on month end flows and a continued surge of Covid-19 infections in the United States and across Europe.
Australia’s ASX 200 index fell 0.55 % and Japan’s Nikkei 225 index dropped 1.33%, as S&P 500 futures plunged over 2%.
Crude oil prices slid 1.5% on global demand fears while gold pushed back above the $1,870/oz mark.
Silver recovered lost ground as yields on US 10-year Treasuries drifted marginally lower.
Looking ahead, Euro-zone inflation and GDP data headline the economic docket alongside US personal spending and consumer price growth data for the month of September.
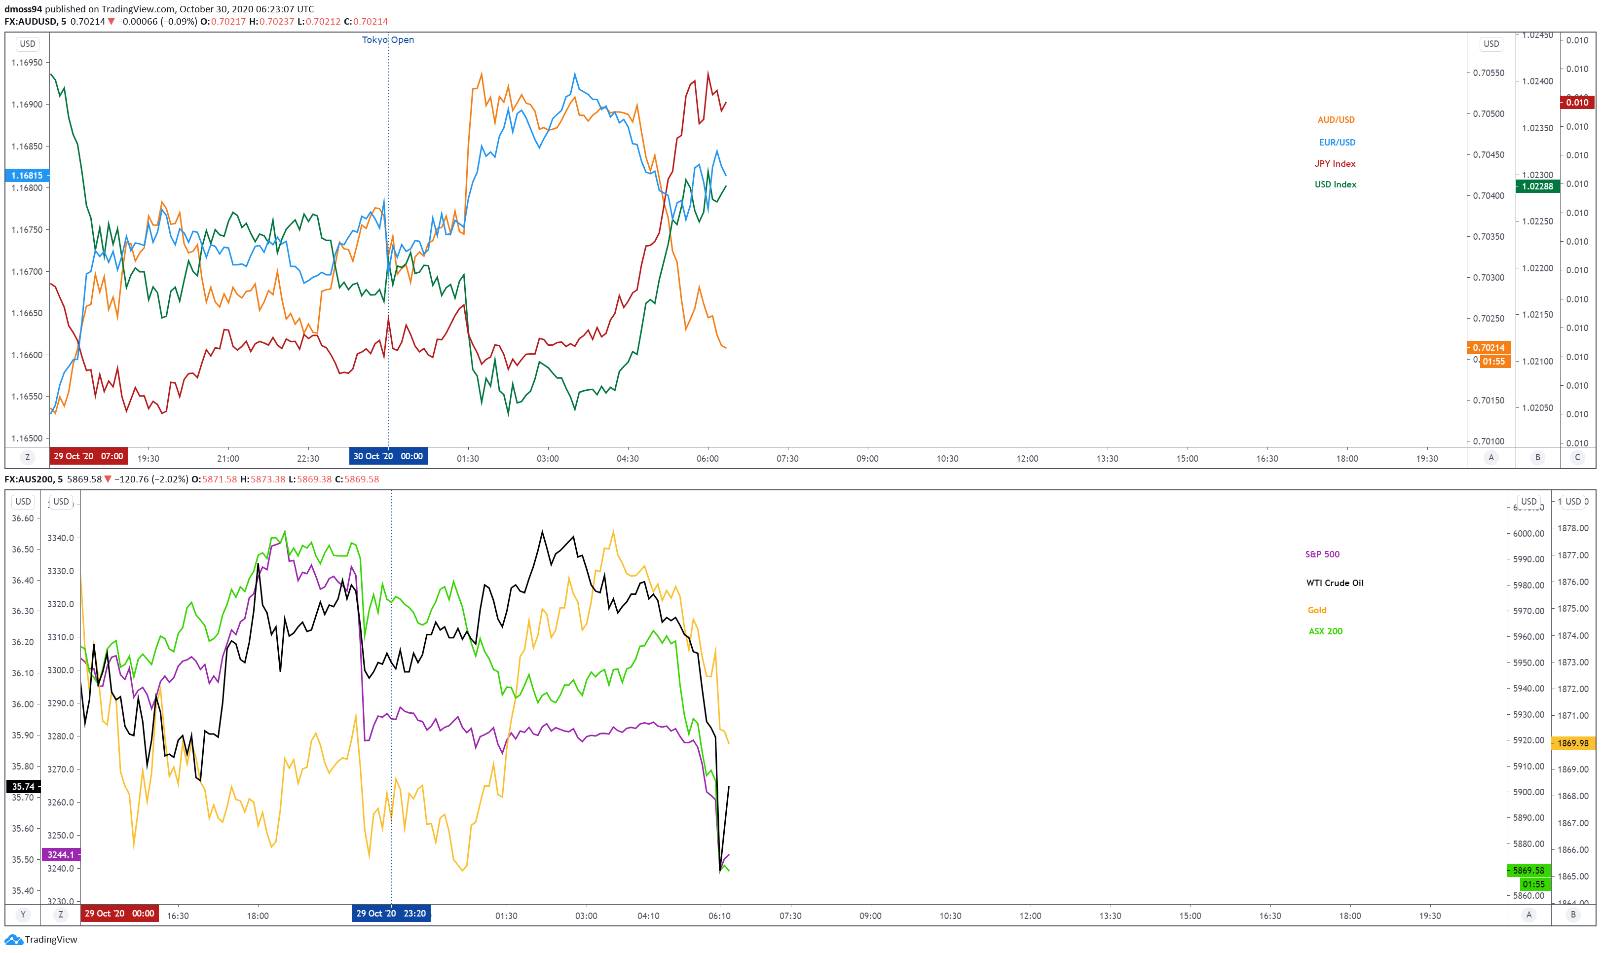
Market reaction chart created using TradingView
Wave of Coronavirus-Enforced Restrictions to Drag on EU Stoxx 50
The resurgence of the novel coronavirus across Europe has forced local authorities to impose economically-devastating restrictions, which in turn have led to the marked discounting of regional risk-sensitive assets.
With the 7-day moving average of Covid-19 infections climbing to 39,000 and the number of deaths beginning to notably rise French President Emmanuel Macron moved to ban domestic travel and the operation of non-essential businesses.
Macron stated that “the virus is circulating at a speed that even the most pessimistic forecast didn’t see [and] the measures we’ve taken have turned out to be insufficient to counter a wave that’s affecting all of Europe”.
French Finance Minister Bruno Le Maire has stressed that the government is hoping to limit the drop in overall economic activity to 15% during the national lockdown, which would be approximately half of the drop seen during the first lockdown in March.
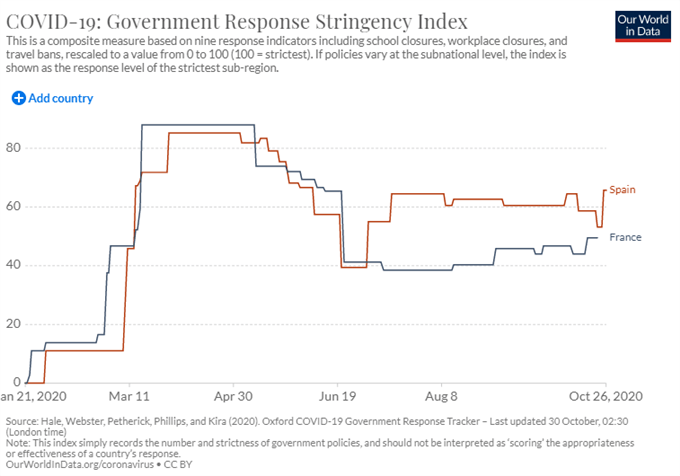
Spain has also been placed under a nationwide curfew as Prime Minster Pedro Sanchez attempts to extend the nation’s state of alarm until May next year, in order to enhance the restrictive measures at the disposal of regional government and “limit our mobility [and] reduce our social relationships”.
Given recent economic data out of France and Spain has shown a significant slowdown in their respective recoveries, the introduction of more stringent measures is almost certain to exacerbate the reduction in GDP growth.
Spain’s services PMI for September recorded its sharpest reduction since May, while France’s composite PMI for October is expected to fall further into contractionary territory.
Therefore, the tightening of restrictions may continue to undermine the French CAC 40 and Spanish IBEX 35 indices and potentially lead to a period of extended losses.
CAC 40 Index Futures Daily Chart – Oversold Readings Hint at Further Losses
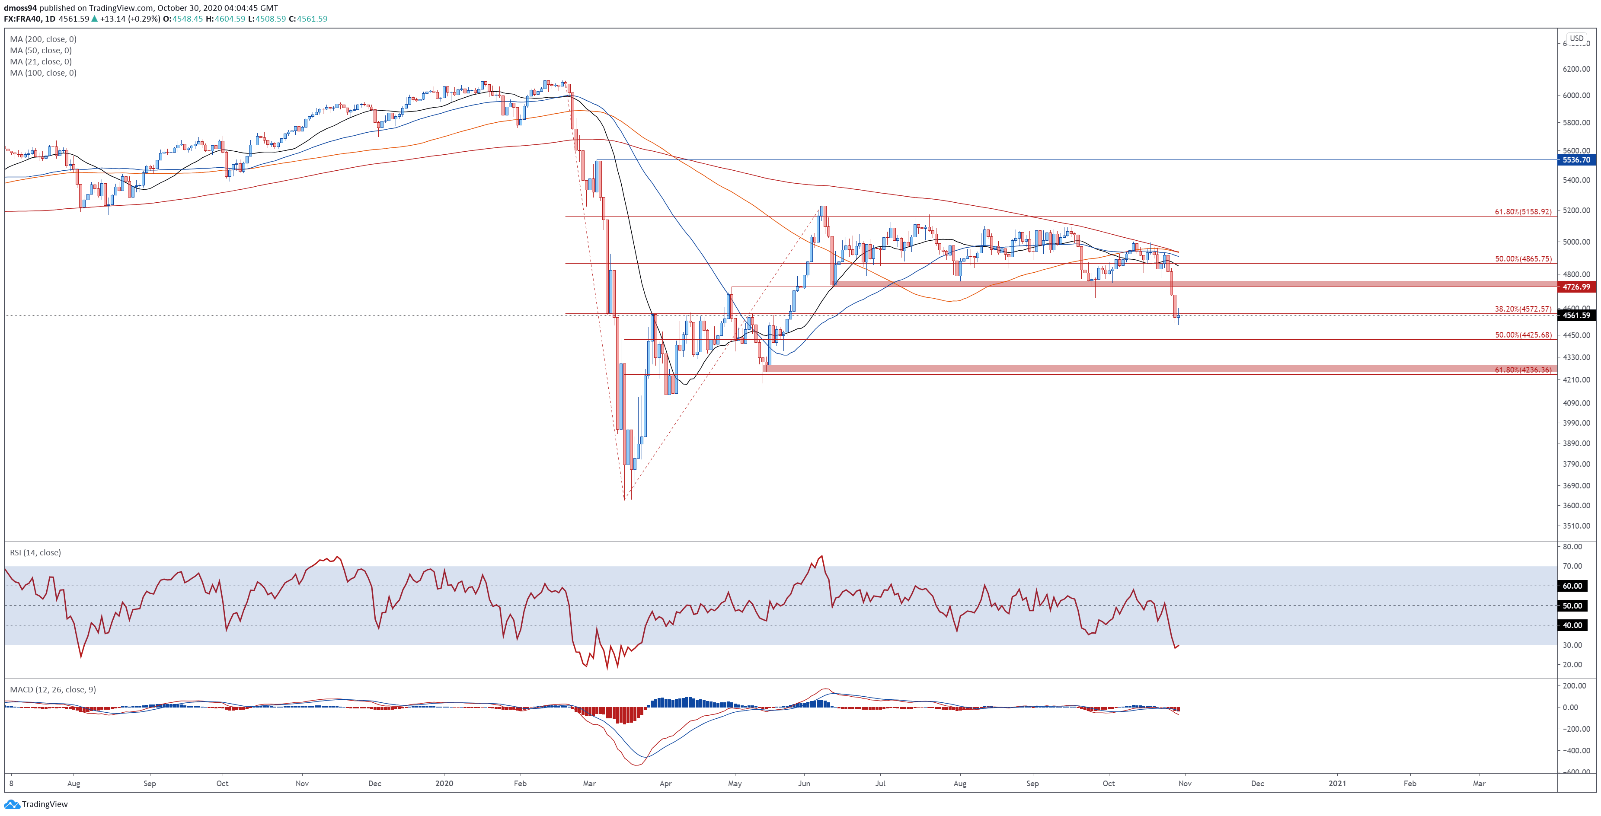
CAC 40 index futures daily chart created using TradingView
From a technical perspective, the outlook for France’s benchmark CAC 40 index remains skewed to the downside, as price collapses below support at the 38.2% Fibonacci (4572.57) and the RSI slides into oversold territory for the first time since March.
However, if the psychologically imposing 4500 mark continues to stifle selling pressure a relief rally back towards range resistance at 4730-4750 could be on the cards.
That being said, with buyers struggling to overcome the 38.2 % Fibonacci and the MACD indicator sliding into negative territory, the path of least resistance looks tilted to the downside.
Failure to climb back above 4600 could see the CAC 40 extend its losses, with a break below the monthly low (4508.59) probably signalling the resumption of the primary downtrend and bring key support levels at the 50% (4425.68) and 61.8% (4236.36) Fibonacci’s into play.
CAC 40 Index Futures 4-Hour Chart – Descending Schiff Pitchfork Confining Price Action

CAC 40 index futures 4-hour chart created using TradingView
Zooming into a 4-hour timeframe reinforces the bearish outlook depicted on the daily chart, as price begins to consolidate below psychological resistance at the 4600 mark and the Descending Pitchfork median.
With the RSI continuing to track within oversold territory and the MACD indicator plunging to its most negative intraday levels since March, selling pressure may intensify in the near term.
Yet due to the extensive nature of the downside move, a counter-trend push towards confluent resistance at the pitchfork 50% parallel and 38.2% Fibonacci (4695.50) is hardly out of the question.
Nevertheless, further losses seem likely if psychological resistance stays intact, with a break below the October 29 low (4508.59) needed to ignite a push towards the 50% Fibonacci (4425.68).
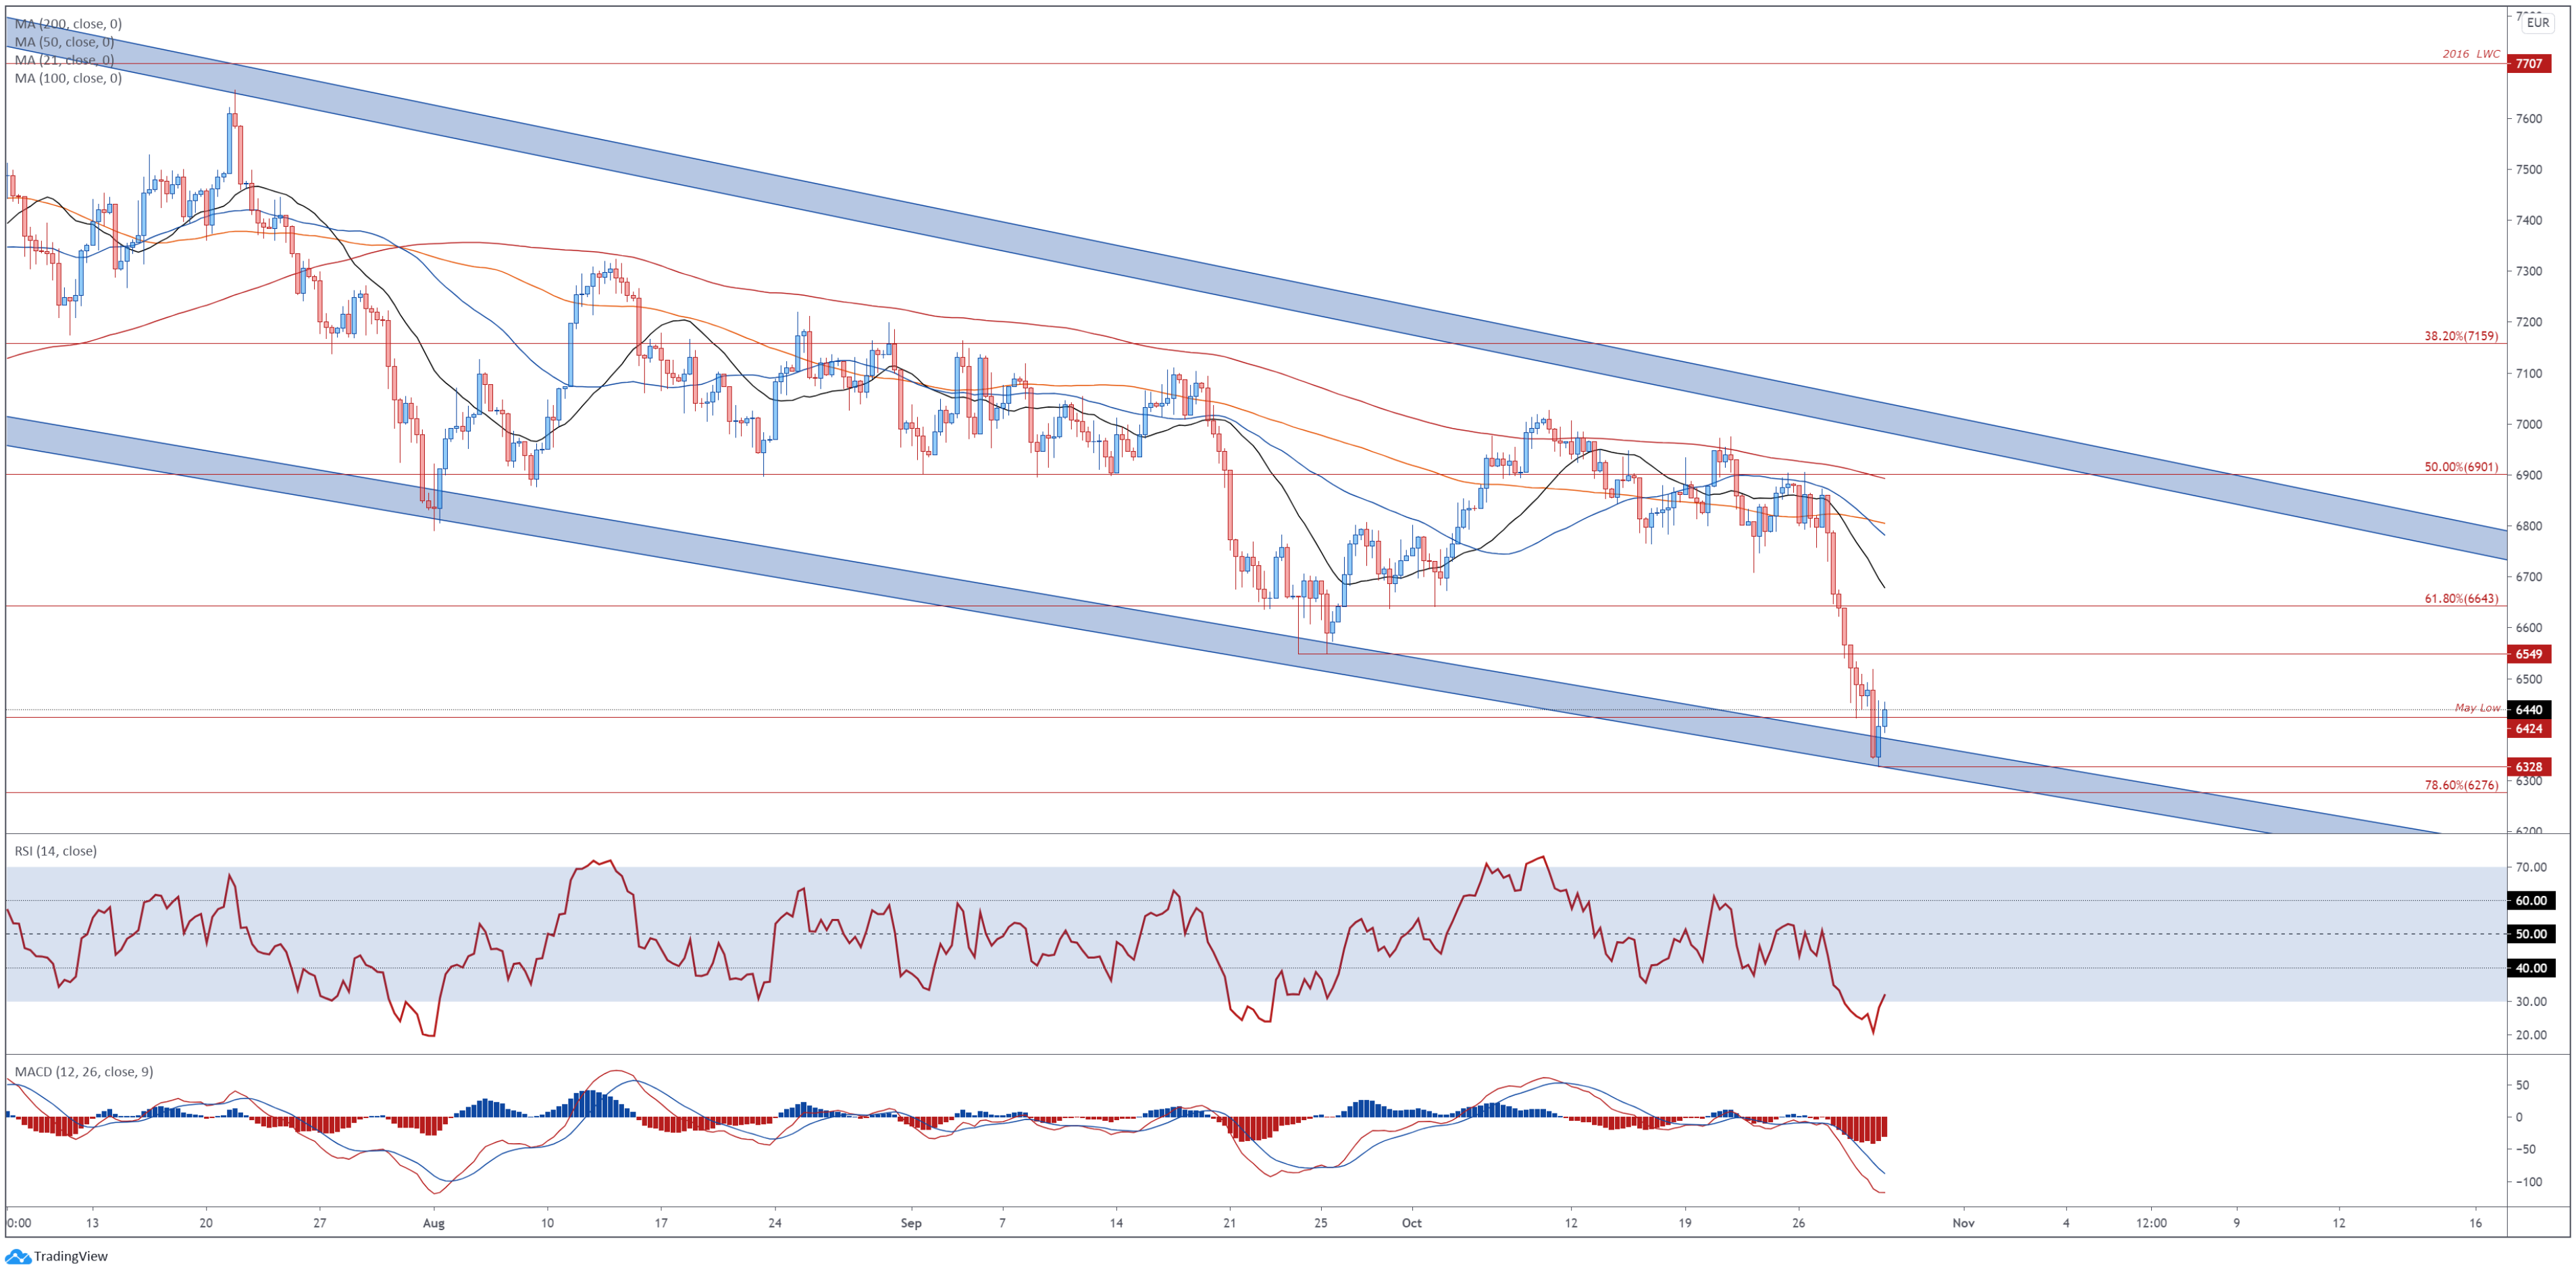
IBEX 35 Daily Chart – Bullish Hammer Reversal in Play
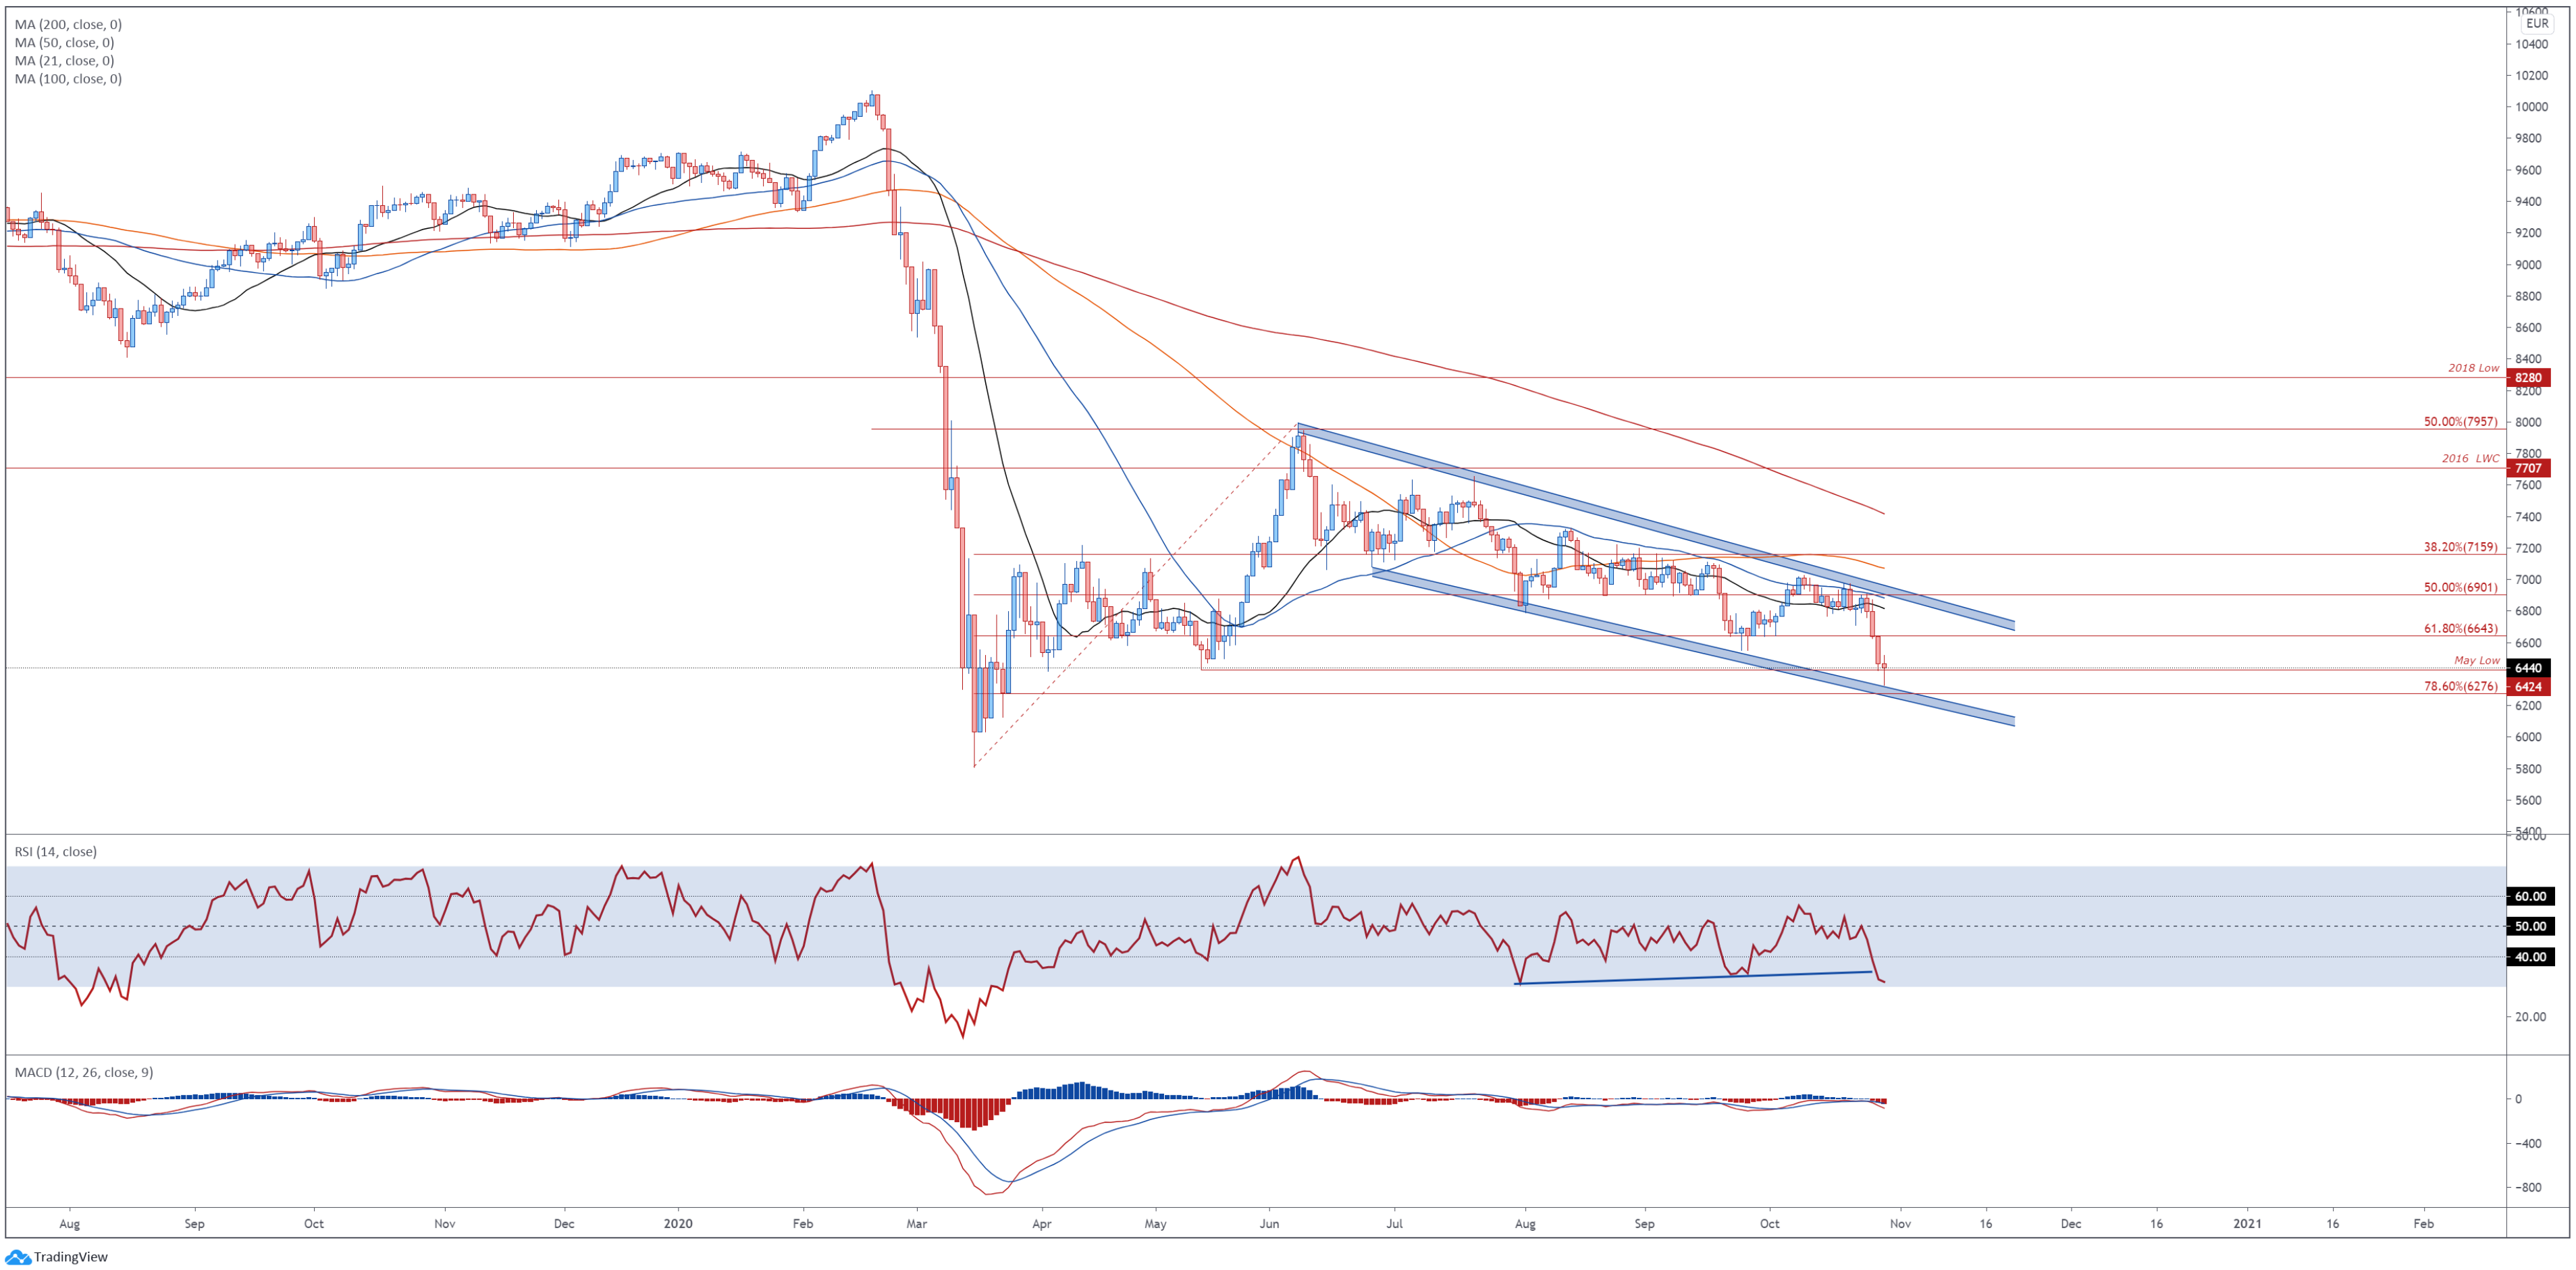
IBEX 35 index futures daily chart created using TradingView
A bullish Hammer reversal candle at Descending Channel support suggests that the Spanish IBEX 35 index may recover lost ground in the coming days.
Moreover, the development of the RSI hints at building bullish momentum, as the oscillator swerves away from oversold territory.
A topside push towards the 61.8% Fibonacci (6643) could be in the offing if price remains constructively perched above the May low (6424), with a daily close above the 50% Fibonacci (6901) needed to invalidate the bearish continuation pattern.
Conversely, an extended slide back towards support at the 78.6% Fibonacci (6276) would probably open the door for the IBEX 35 to retest the yearly low (5809), if the 6400 level gives way.
IBEX 35 Index 4-Hour Chart – Attempting to Grind Higher
IBEX 35 index futures 4-hour chart created using TradingView
Intraday price action suggests that a rally higher may be limited in nature, as the RSI and MACD indicator plunge to their most extreme bearish readings since early August and buyers struggle to pierce through the 6450 level.
Nonetheless, with both oscillators beginning to head back towards their neutral midpoints the Spanish benchmark index may claw back towards the September 24 low (6549), with a breach of the 38.2% Fibonacci (6595) needed to inspire a more extensive recovery.
On the contrary, support at the 78.6% Fibonacci (6276) may come under pressure if the monthly low (6328) gives way.
-- Written by Daniel Moss, Analyst for DailyFX
Follow me on Twitter @DanielGMoss


