


Canadian Dollar, USD/CAD, Bank of Canada – Talking Points:
- The ASX 200 index fell as much as 2% during Asia-Pacific trade after Facebook threatened to ban Australians from sharing news on the platform
- Canadian manufacturing PMI may encourage the BoC to take their foot off the stimulus throttle.
- USD/CAD rates poised to extend decline after slicing through multi-year trend support.
Asia-Pacific Recap
The Australian ASX 200 index plunged as much as 2% during Asia-Pacific trade after Facebook threatened to ban residents from sharing news on the social media platform.
The haven-associated US Dollar and Japanese Yen continued to lose ground against their major counterparts as Chinese Caixin Manufacturing PMI for August exceeded expectations.
AUD/USD held steady at yearly highs as the Reserve Bank of Australia opted to maintain the status quo.
Gold and silver rose despite yields on US 10-year Treasuries nudging slightly higher.
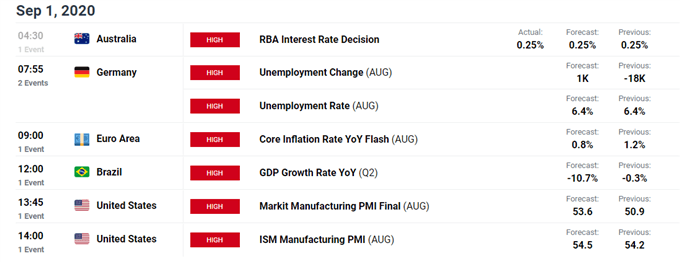
Looking ahead, US manufacturing PMI and German unemployment data for August highlight the economic docket.
USD/CAD May Extend Declines Ahead of Canadian Manufacturing PMI
The USD/CAD exchange rate’s plunge to its lowest levels since early January may intensify in the coming days as Canadian manufacturing PMI for August shifts into focus.
The impact of upcoming economic data is intensified due to the suggestion by several members of the Bank of Canada that monetary policy may be at its effective limit.
Deputy Governor Carolyn Wilkins stated that “central banks are likely to run out of conventional firepower if we see an economic downturn in a low-interest-rate world” at the central bank’s Monetary Policy Framework review on August 26.

This was followed up by Governor Tiff Macklem’s statement that “many people don’t feel like inflation is falling when food inflation has been averaging almost 3 percent” at the Federal Reserve’s Jackson Hole symposium.
Of course, these quotes hardly scream that the BoC is contemplating withdrawing all forms of stimulus measures and considering hiking interest rates, but it does signal that Canadian policymakers are becoming more sensitive to the potential impact of alternative monetary policy measures.
With that in mind, positive economic data could encourage the central bank to begin rolling back some of its existing policy measures, which may serve to underpin the Canadian Dollar against its major counterparts.
USD/CAD Weekly Chart – Break of 8-Year Uptrend Ominous for USD Bulls
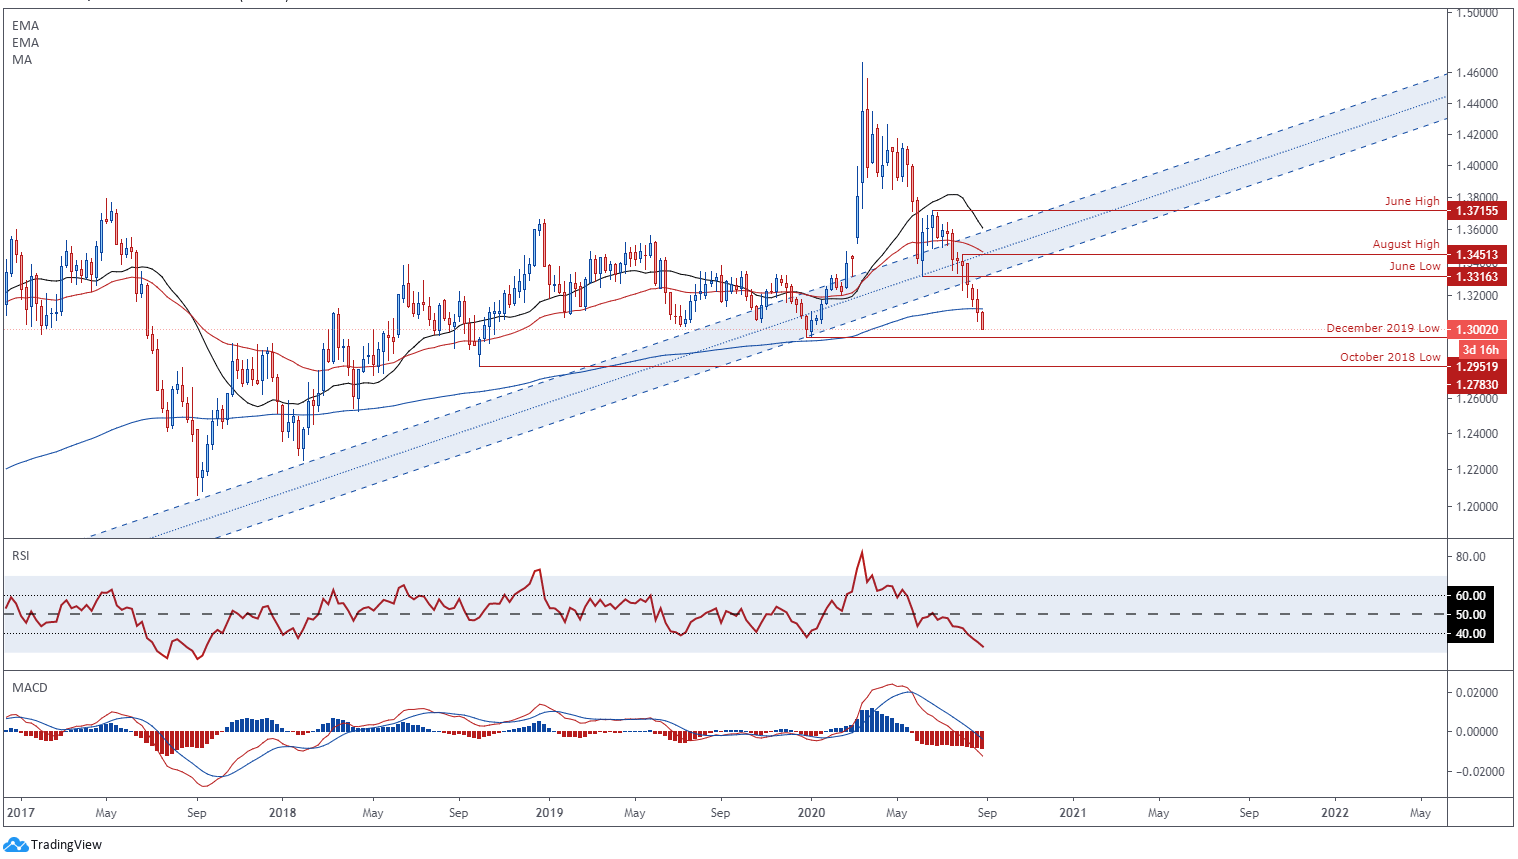
USD/CAD weekly chart created using TradingView
From a technical perspective, USD/CAD appears poised to extend its fall from the yearly high after plunging through 8-year trend support, as the RSI dives to its lowest level since late 2017 and the MACD indicators slides into negative territory.
With price now tracking below the sentiment-defining 200-week moving average (1.3123), selling pressure could intensify in the near term as USD/CAD beelines toward support at the December 2019 low (1.2952).
A weekly close below the psychologically pivotal 1.29 level would probably coincide with oversold readings on the RSI and could carve a path for price to test the October 2018 low (1.2783).
USD/CAD Daily Chart – Further Losses in the Offing as RSI Dips into Oversold
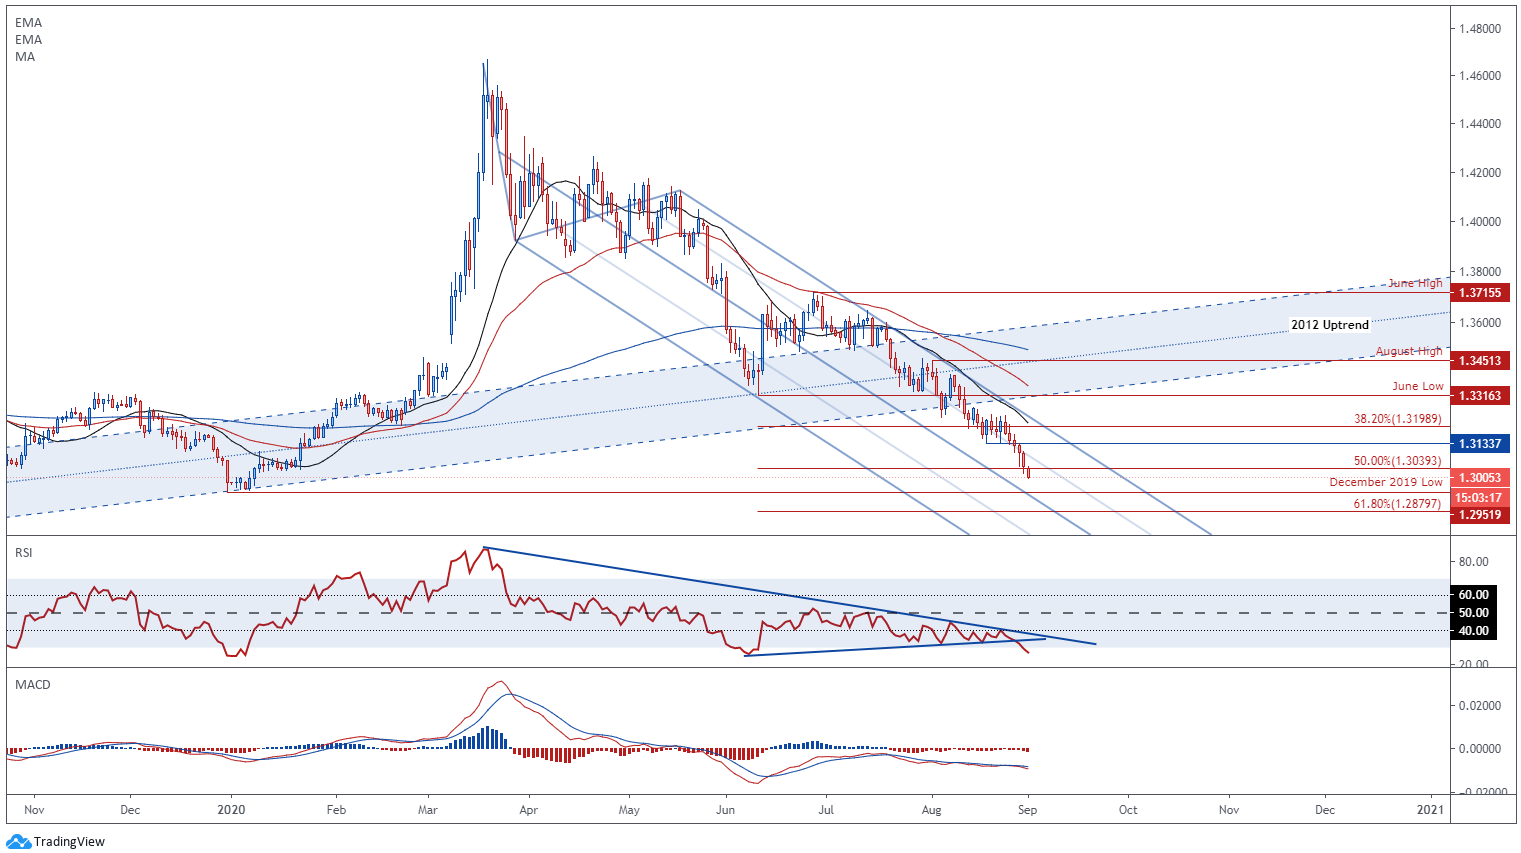
USD/CAD daily chart created using TradingView
Zooming into a daily chart reinforces the bearish outlook seen on higher timeframes, as price collapses through support at the 50% Fibonacci (1.3039) and the RSI dives into oversold territory.
Given USD/CAD remains encapsulated by a descending Schiff Pitchfork and continues to track below the 21-, 50- and 200-day moving averages, the path of least resistance seems to be lower.
With that in mind, price may continue to retreat towards confluent support at the December 2019 low (1.2952) and pitchfork median line if sellers successfully overcome psychological support at the 1.30 level.
| Change in | Longs | Shorts | OI |
| Daily | 25% | -13% | -3% |
| Weekly | 23% | -3% | 5% |
-- Written by Daniel Moss, Analyst for DailyFX
Follow me on Twitter @DanielGMoss


