


US Dollar, Jackson Hole Symposium, Federal Reserve, USD/JPY – Talking Points:
- Equity markets drifted lower during Asia-Pacific trade.
- Jackson Hole Symposium could ignite further USD selling
- USD/JPY at risk of extended losses after failing to break above moving average resistance
Asia-Pacific Recap
Equity markets drifted lower during Asia-Pacific trade, with the Australian ASX 200 sliding 0.25% alongside Japan’s Nikkei 225 index.
The US Dollar clawed back lost ground against its major counterparts, whilst the haven-associated Japanese Yen nudged marginally lower.
Gold retreated despite falling bond yields and crude oil prices slid despite Hurricane Laura concerns.
Looking ahead, Federal Reserve Chair Jerome Powell’s speech at the Jackson Hole Economic Symposium headlines the economic docket alongside US jobless claims data.
Kansas City Fed Alluding to What’s to Come?
The shift in tone from one of the Federal Reserve’s most hawkish policy makers could be indicative of what’s to come later today, as Chairman Jerome Powell is scheduled to deliver a speech reviewing the central bank’s monetary policy framework at the Jackson Hole economic symposium.
The notoriously hawkish Kansas City Fed President Esther George appears to agree with her colleague Neel Kashkari in his support for a mild overshoot in inflation, stating that she “never thought of 2% as a ceiling but [is really]focused on what anchors inflation expectations in the economy”.
George also dismissed the notion that inflationary pressures are rising, stating that “what we see today are really, generally deflationary kinds of forces [and] until demand comes back, until we see the economy regain its footing, it’s hard to see [inflation] in the near term”.
With the central bank appearing to widen its mandated goal posts it seems accommodative monetary policy measures will remain in place for the foreseeable future, given inflation still remains below the 2% target rate.
To that end, US Dollar weakness is likely to continue as policymakers keep their foot on the stimulus gas pedal in the hunt for inflation and a lower unemployment rate.

USD Index** Daily Chart – Bear Flag Could Trigger Sell-Off
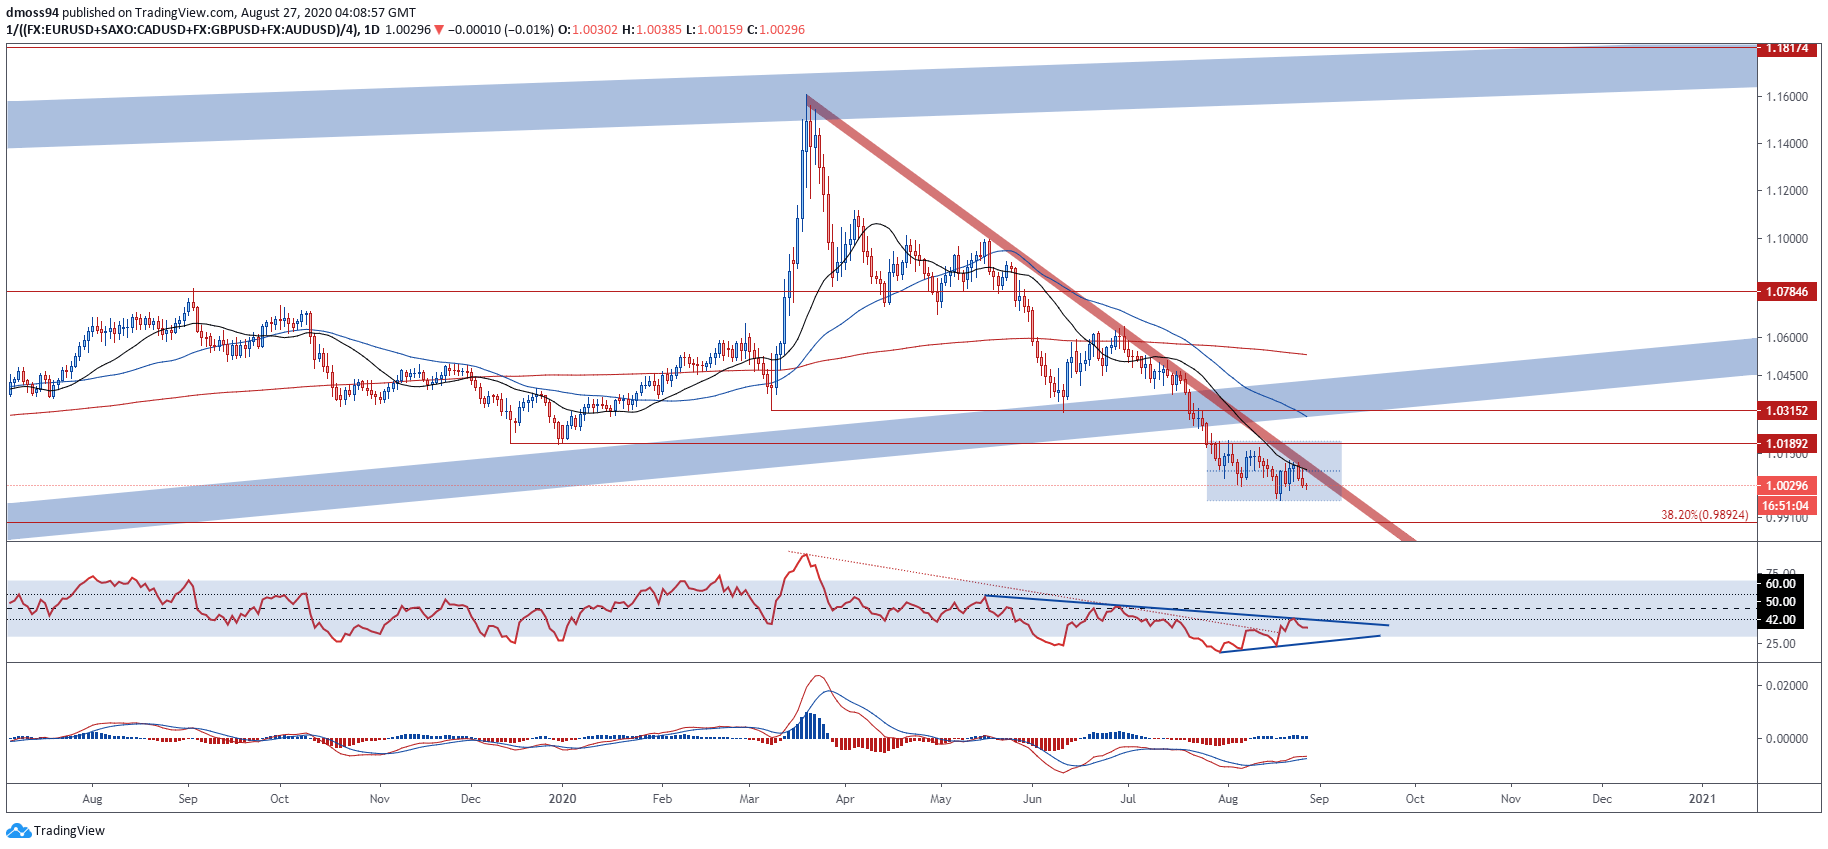
USD Index** daily chart created using TradingView
**USD Index averages EUR/USD, CAD/USD, GBP/USD, AUD/USD
The US Dollar continues to consolidate in a Bear Flag continuation pattern after collapsing through the 2011 uptrend at the end of last month and may be gearing up for a push to fresh yearly lows, as price slides away from the 21-day moving average and the RSI fails to snap its 12-week downtrend.
A bearish cross-over on the MACD indicator could intensify selling pressure and potentially fuel a break below flag support (0.9973), with price closing at a fresh yearly low probably signalling a resumption of the primary downtrend.
With that in mind, further declines look likely for the under-fire Greenback if the bearish continuation pattern begins to play out.
The implied measured move could see price fall a further 6.6% on average against its major counterparts and slide to its lowest levels since January 2018.
USD/JPY Daily Chart – Price Guided Lower by Descending Channel

USD/JPY daily chart created using TradingView
The tepid 7-day rally in USD/JPY rates is at risk of breaking down after failing to break above the trend-defining 50-day moving average, as price continues to travel within the confines of a bearish Descending Channel.
Furthermore, the RSI’s inability to overcome its two-month downtrend and break above its neutral midpoint, alongside the sustained negative tilt seen on the MACD indicator, hint that the path of least resistance is lower.
Therefore, a daily close below the May low (105.99) could open a path for price to slide back towards the March uptrend, with a break of 61.8% Fibonacci support (105.20) probably intensifying selling pressure and signalling the resumption of the primary downtrend.
| Change in | Longs | Shorts | OI |
| Daily | -2% | 3% | 2% |
| Weekly | 8% | -11% | -8% |
-- Written by Daniel Moss, Analyst for DailyFX
Follow me on Twitter @DanielGMoss


