


Canadian Dollar, USD/CAD, CAD/JPY, CAD/CHF, BoC – Talking Points:
- USD/CAD set to extend its run lower as it dangles above short-term support
- ‘Golden Cross’ formation may fuel a surge in CAD/JPY rates
- CAD/CHF coiling up to close out the month
BoC Flag Monetary Policy Limitations, CAD May Benefit
The Canadian Dollar may continue to outperform its haven-associated counterparts into the tail-end of the year, buoyed by the loosening of coronavirus restrictions, relatively resilient oil prices and the Bank of Canada’s suggestion that monetary policy may be at its effective limit.
The BoC’s Deputy Governor Carolyn Wilkins warned that “central banks are likely to run out of conventional firepower if we see an economic downturn in a low-interest-rate world” at the central bank’s Monetary Policy Framework review on August 26.
Wilkins added that although measured inflation “is close to zero, many people feel that inflation is higher than reported” and cited the example of the 4% rise in the Canadian meat prices since February as unreflective of “low inflation”.
These comments from the BoC’s second-in-command could indicate that the central bank is contemplating rolling back some of its existing policy measures in the near-term, which may serve to underpin the Canadian Dollar against its major counterparts.
USD/CAD Daily Chart – Schiff Pitchfork Guiding Price Lower
USD/CAD daily chart created using TradingView
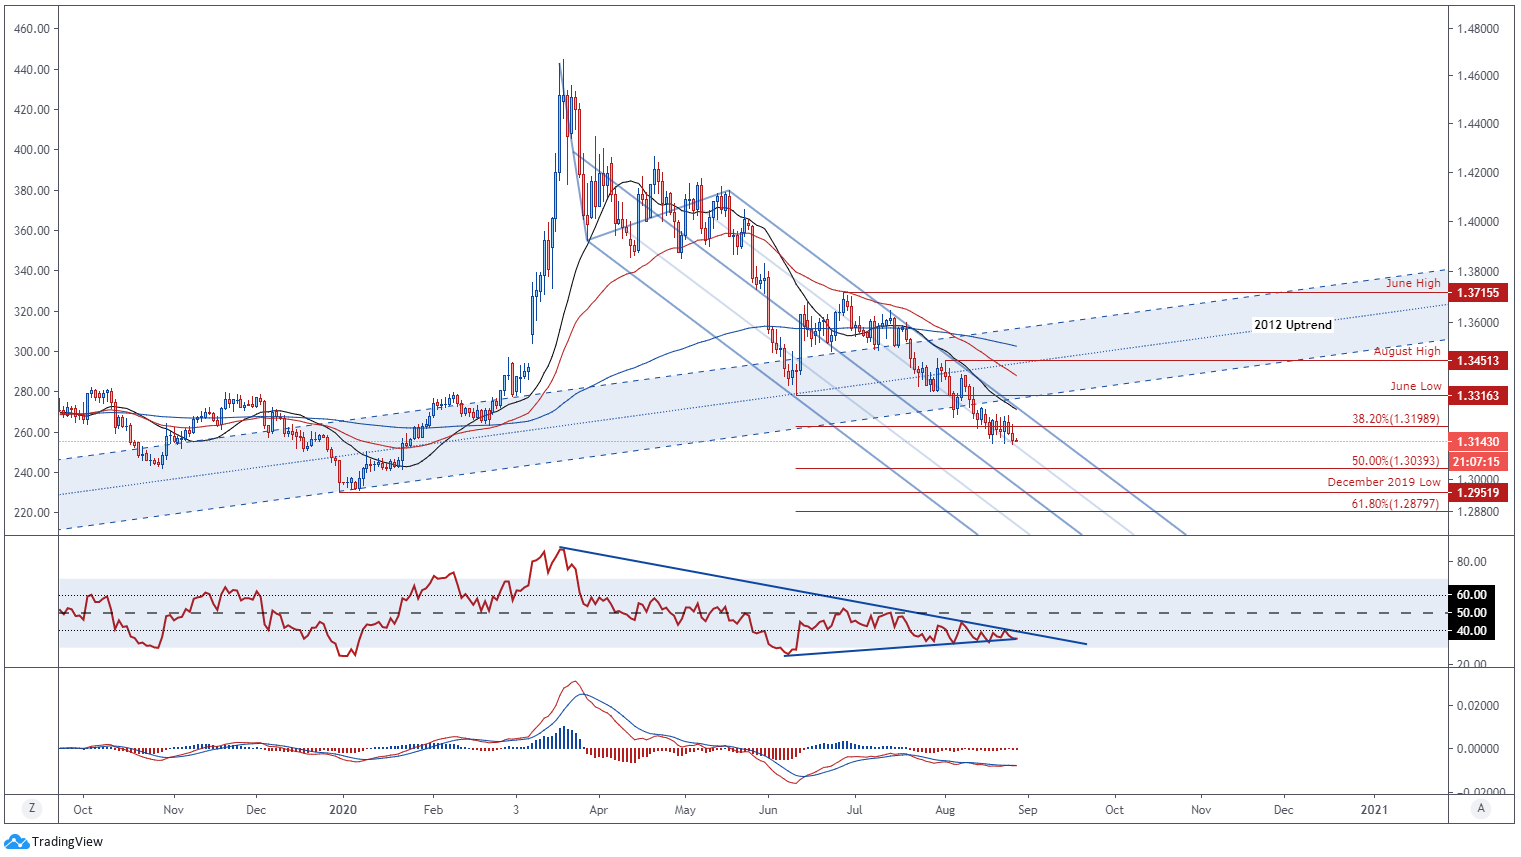
From a technical perspective, USD/CAD rates appear to be gearing up for an extended push lower as price consolidates below the psychologically pivotal 1.32 level after snapping through the 2011 uptrend earlier in the month.
Although the RSI has trekked higher since sliding into oversold territory in early June, it remains confined by the downtrend extending from the yearly extremes while the MACD indicator continues to hover below 0.
This could be indicative of lacking bullish momentum and may encourage selling pressure in the near term.
A daily close below the August 26 low (1.3132) would probably result in price sliding to support at the 50% Fibonacci (1.3039), with oversold readings on the RSI likely exacerbating the decline.
On the other hand, a limited recovery back to confluent resistance at the 38.2% Fibonacci (1.3198) and Schiff Pitchfork parallel could eventuate as the month of August comes to a close.
A break above the 1.32 level is needed to invalidate bearish potential and inspire a sustained recovery to resistance at the June low (1.3316).
| Change in | Longs | Shorts | OI |
| Daily | 9% | -5% | -1% |
| Weekly | -2% | 7% | 4% |
CAD/JPY Daily Chart – ‘Golden Cross’ May Ignite Rally
CAD/JPY daily chart created using TradingView
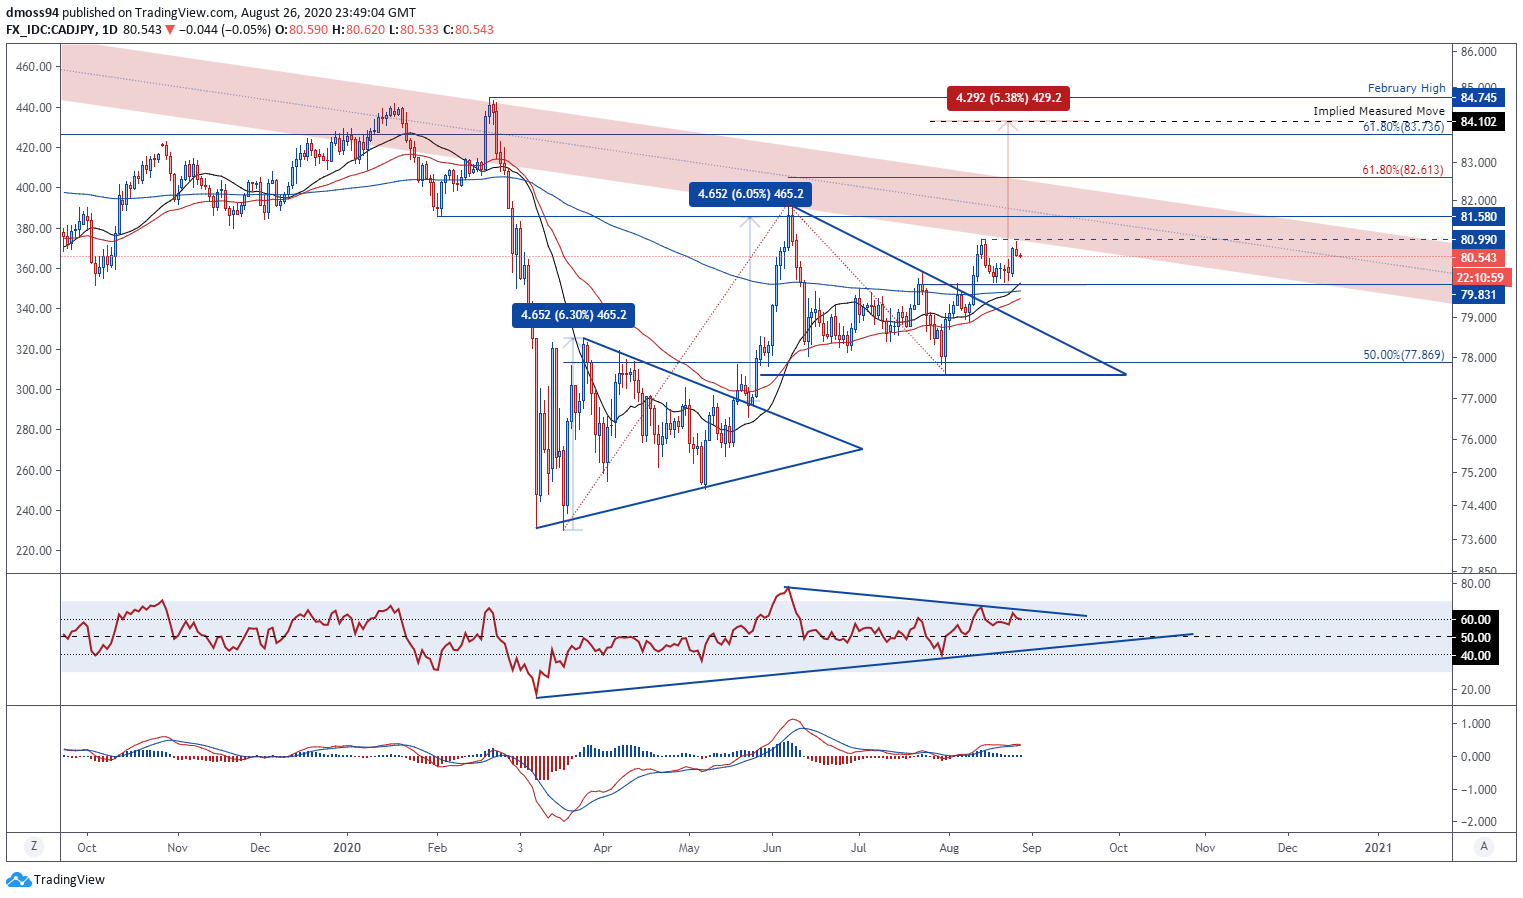
CAD/JPY rates seem poised to extend the recent rally from the July low (77.62) despite failing to overcome resistance at the 81 mark and sliding back to support at the July 22 close (79.83).
In fact, this retracement from the monthly high may have validated the topside break of the Descending Triangle continuation pattern and suggests CAD/JPY could push above the 2015 downtrend (red zone) to fulfil the implied measured move (84.10) just shy of the yearly high (84.74).
With that in mind, a close above the August high (80.99) is needed to signal a resumption of the 4-week uptrend and would probably coincide with the RSI climbing into overbought territory.
On the other hand, a bearish Shooting Star candle could inspire sellers and possibly generate a more sustained correction back to the 21-day moving average (79.86).
CAD/CHF Daily Chart – Coiling Up to Close Out August
CAD/CHF daily chart created using TradingView
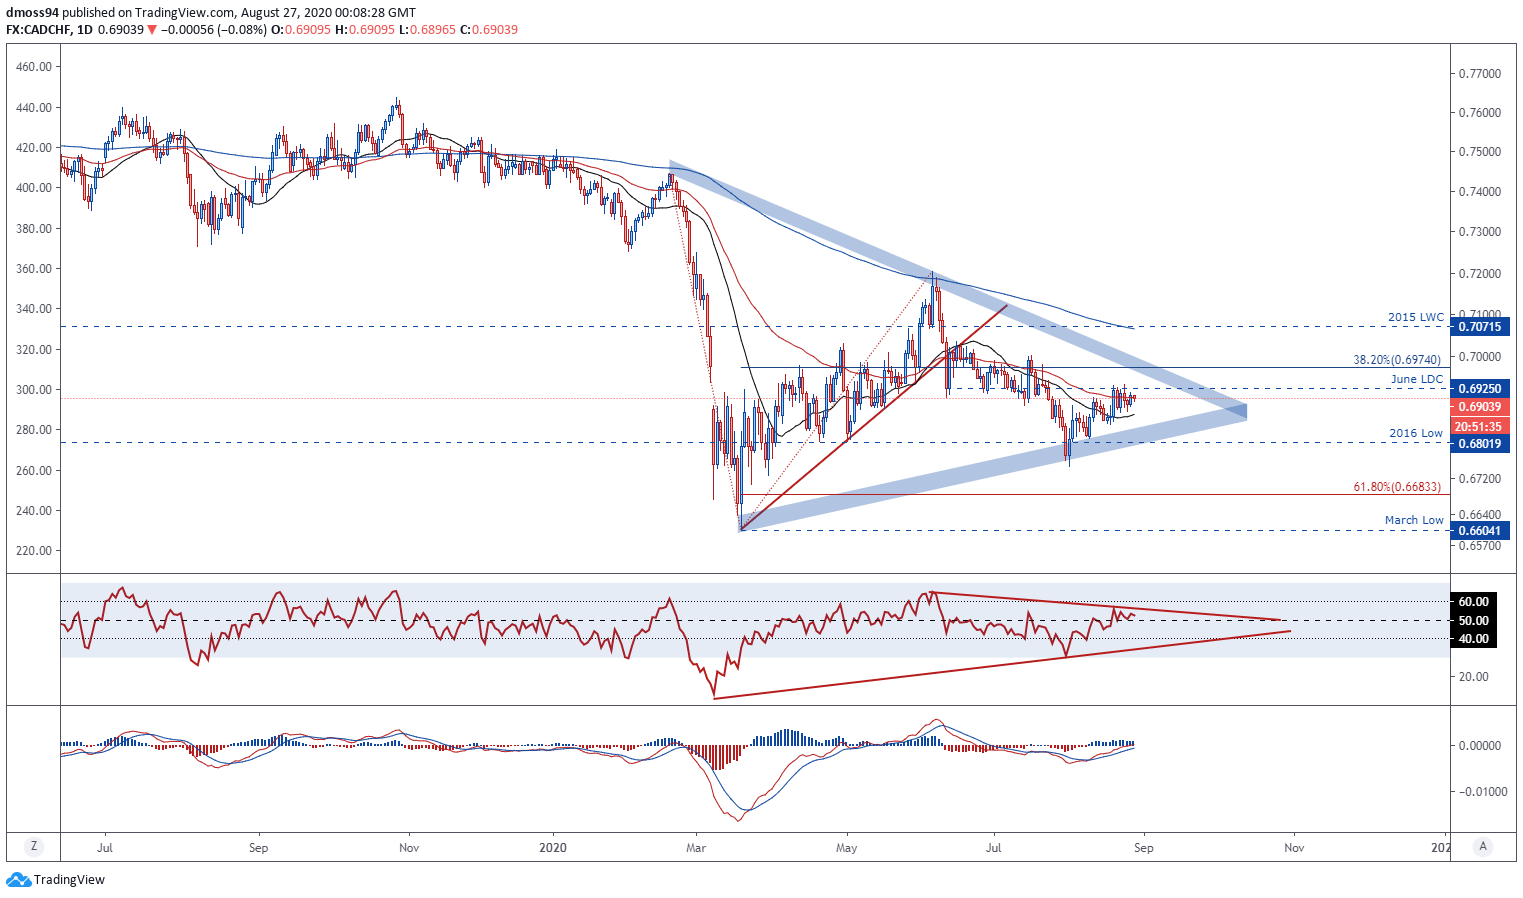
The Canadian Dollar has clawed back lost ground against the Swiss Franc throughout the month of August, as CAD/CHF coils up just shy of the June low daily close (0.6925).
Although price has oscillated in a tight 100-point range, the RSI and MACD indicators hint at swelling bullish momentum.
Furthermore, the notable steepening of the 21-day moving average alongside a series of higher highs and higher lows (0.6869) could fuel a surge to test Symmetrical Triangle resistance and the 38.2% Fibonacci (0.6974).
With a daily close above the July low (0.7001) probably coinciding with the RSI snapping its 8-week downtrend and carving a path for price to test the sentiment-defining 200-DMA (0.7065) and 2015 low weekly close (0.7071).
-- Written by Daniel Moss, Analyst for DailyFX
Follow me on Twitter @DanielGMoss


