


British Pound Outlook, GBP/USD, Brexit Negotiations, European Union – Talking Points:
- The US Dollar continued to struggle during Asia-Pacific trade despite swelling geopolitical tensions
- Renewed Brexit negotiations are likely to dictate the performance of the British Pound against its major counterparts.
- GBP/USD rates are carving out a Bull Flag pattern at key resistance. Is a topside break on the cards?
Asia-Pacific Recap
The haven-associated US Dollar’s struggle continued during Asia-Pacific trade, as the DXY plunged 0.3% whilst the trade-sensitive Australian Dollar climbed back above the 0.7230 level.
The ASX 200 nudged higher whilst the S&P 500 benchmark stock index failed to break to fresh all-time highs.
Gold and silver gained as the yield on the US 10-year Treasury Note dipped back below 70 basis-points.
Looking ahead, US housing starts and building permits data for July may prove market-moving ahead of API crude oil inventories for the week ending August 14.
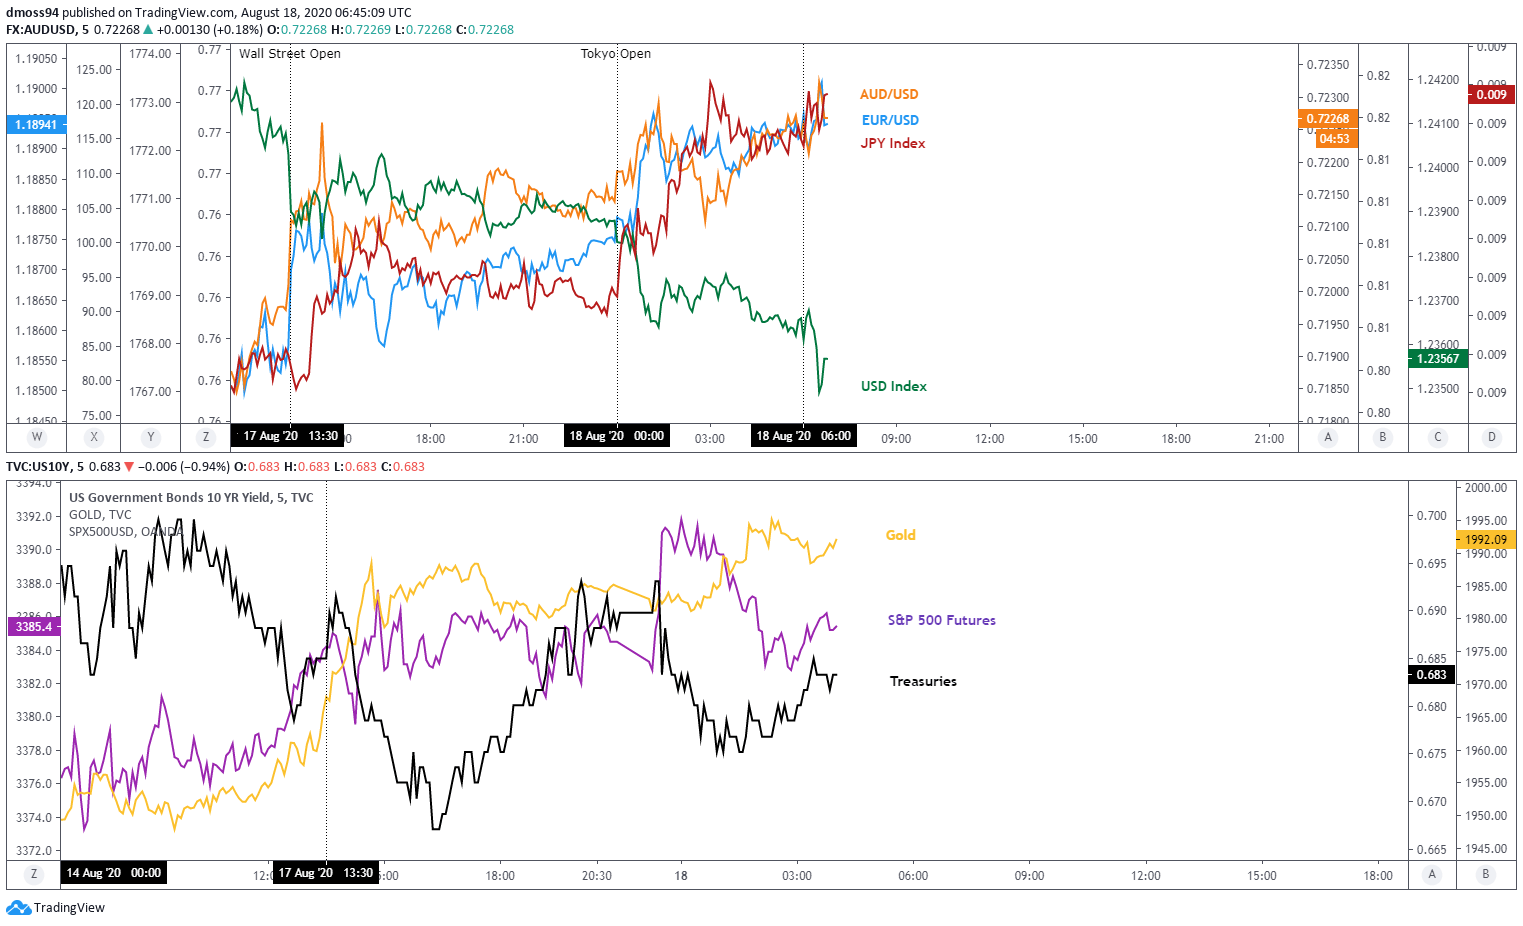
Market reaction chart created using TradingView
GBP/USD Dictated by Brexit Negotiations
The next seven weeks of Brexit negotiations between EU and UK officials will likely define the long-term outlook for the politically-sensitive British Pound and could induce volatility in the interim, as “considerable gaps remain in the most difficult areas, that is, the so-called level playing field and on fisheries” according to the UK’s chief negotiator David Frost.
These contentious issues have been a consistent sticking point throughout negotiations and may lead to a complete breakdown in talks if the UK fails to heed EU chief negotiator Michel Barnier’s warning that “the UK’s refusal to commit to conditions of open and fair competition and to a balanced agreement on fisheries, makes a trade agreement at this point unlikely”.
With negotiations scheduled to conclude on October 2 it seems relatively unlikely that officials will be able to successfully “plug the gaps” needed to deliver an all-encompassing free-trade deal, given the lack of meaningful progress in bilateral trade relations since Britain voted to leave the EU on June 23, 2016.

Nevertheless, Barnier continues “to believe that Prime Minister Boris Johnson and the UK government want to find an agreement with the EU” as he reaffirmed the trading bloc’s “willingness to reach an ambitious partnership agreement in all areas”.
Clearly both sides have plenty to lose should talks disintegrate and may be willing to compromise in order to shelter their recovering economies from the imposition of economically crippling quotas and tariffs.
With that in mind, a notable progression in negotiations could underpin the British Pound against its major counterparts and soothe market participants' concerns about a potential ‘no-deal’ Brexit outcome.
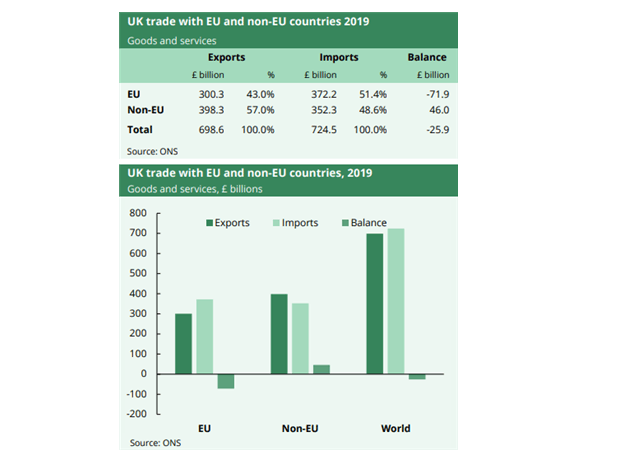
Source – Office for National Statistics
GBP/USD Daily Chart – Bull Flag Forming at Key Resistance
GBP/USD rates appear to be carving a Bull Flag continuation pattern just shy of key resistance at the March high (1.3200), after exploding through the downtrend extending from the 2019 high (1.3515) towards the tail-end of July.
An extended push towards the 1.36 level looks in the offing as the RSI climbs back into overbought territory and the trend-defining 50-day moving average (1.2790) crosses above its ‘slower’ 200-period counterpart (1.2665).
A daily close above the March high (1.2300) is needed to validate a topside break of the bullish pattern and open a path for price to push to fresh yearly highs.
On the other hand, a break below the monthly low could trigger a sustained correction back towards the June (1.2813) and April high (1.2648).
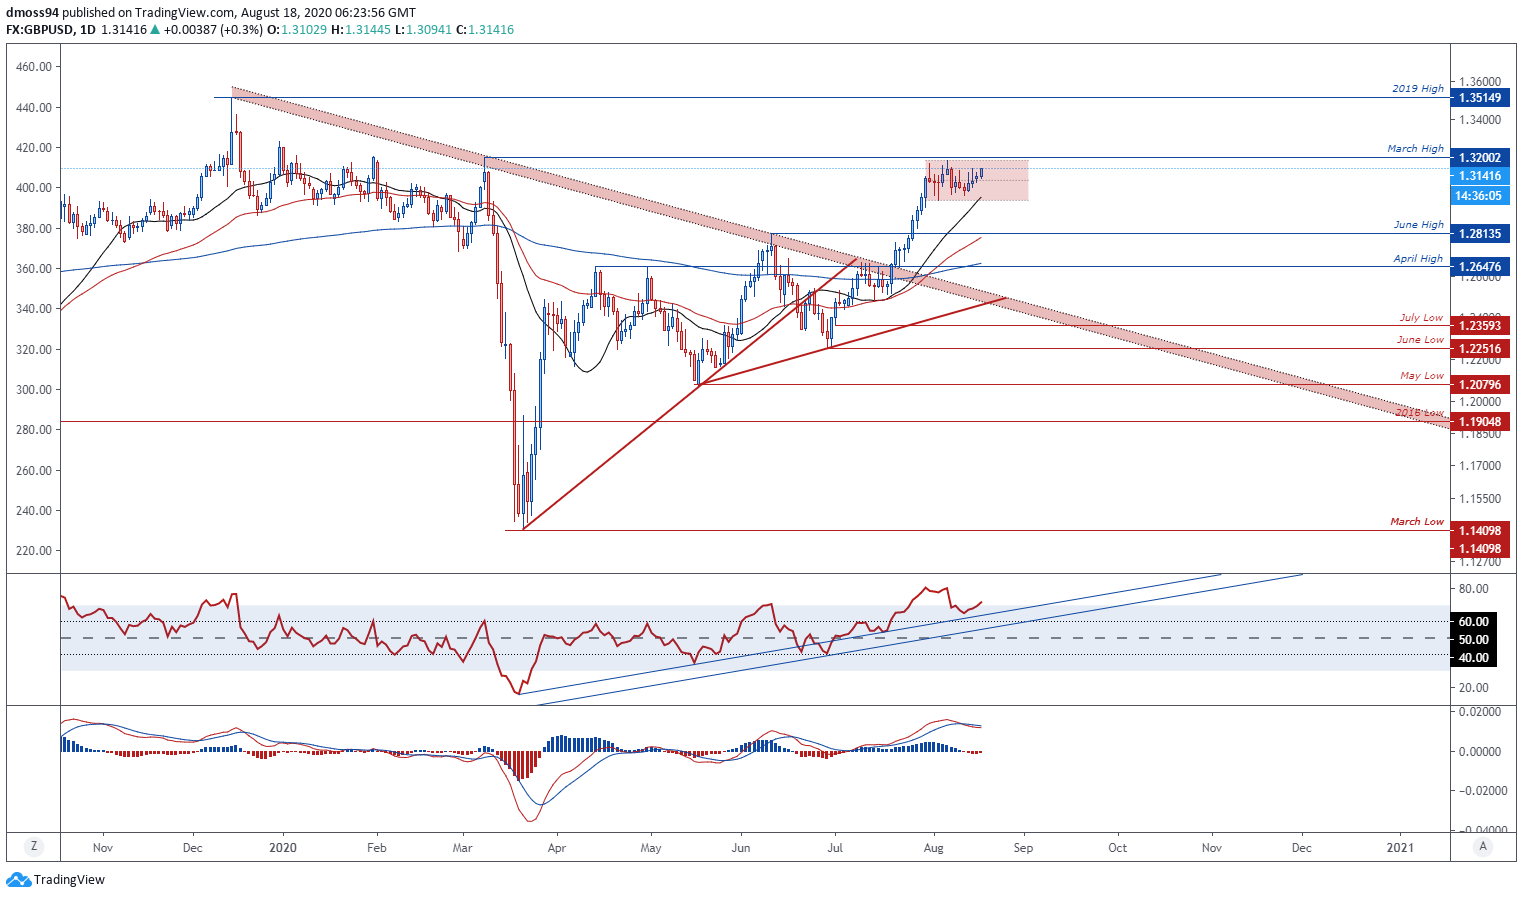
GBP/USD daily chart created using TradingView
| Change in | Longs | Shorts | OI |
| Daily | -3% | 4% | -1% |
| Weekly | 3% | 2% | 3% |
-- Written by Daniel Moss, Analyst for DailyFX
Follow me on Twitter @DanielGMoss


