


EUR/USD, European Central Bank, ZEW Economic Sentiment Index – Talking Points:
- The US Dollar clawed back lost ground against its major counterparts as investors mull the prospects of additional fiscal stimulus out of the US.
- Positive economic data out of Germany may underpin the growth-sensitive Euro.
- EUR/USD Bull Flag pattern at key resistance suggests further upside is in the offing.
Asia-Pacific Recap
The US Dollar clawed back lost ground against its major counterparts during Asia-Pacific trade, exacerbating the New Zealand Dollar’s declines after the RBNZ expanded its Large-Scale Asset Purchase (LSAP) program.
Gold and silver continued their respective slides as bond yields continued to trek higher. The haven-associated Japanese Yen held relatively steady whilst the risk-sensitive Australian Dollar fell back towards the 0.71 level.
Looking ahead, UK GDP data may prove market moving ahead of the US CPI release for July.
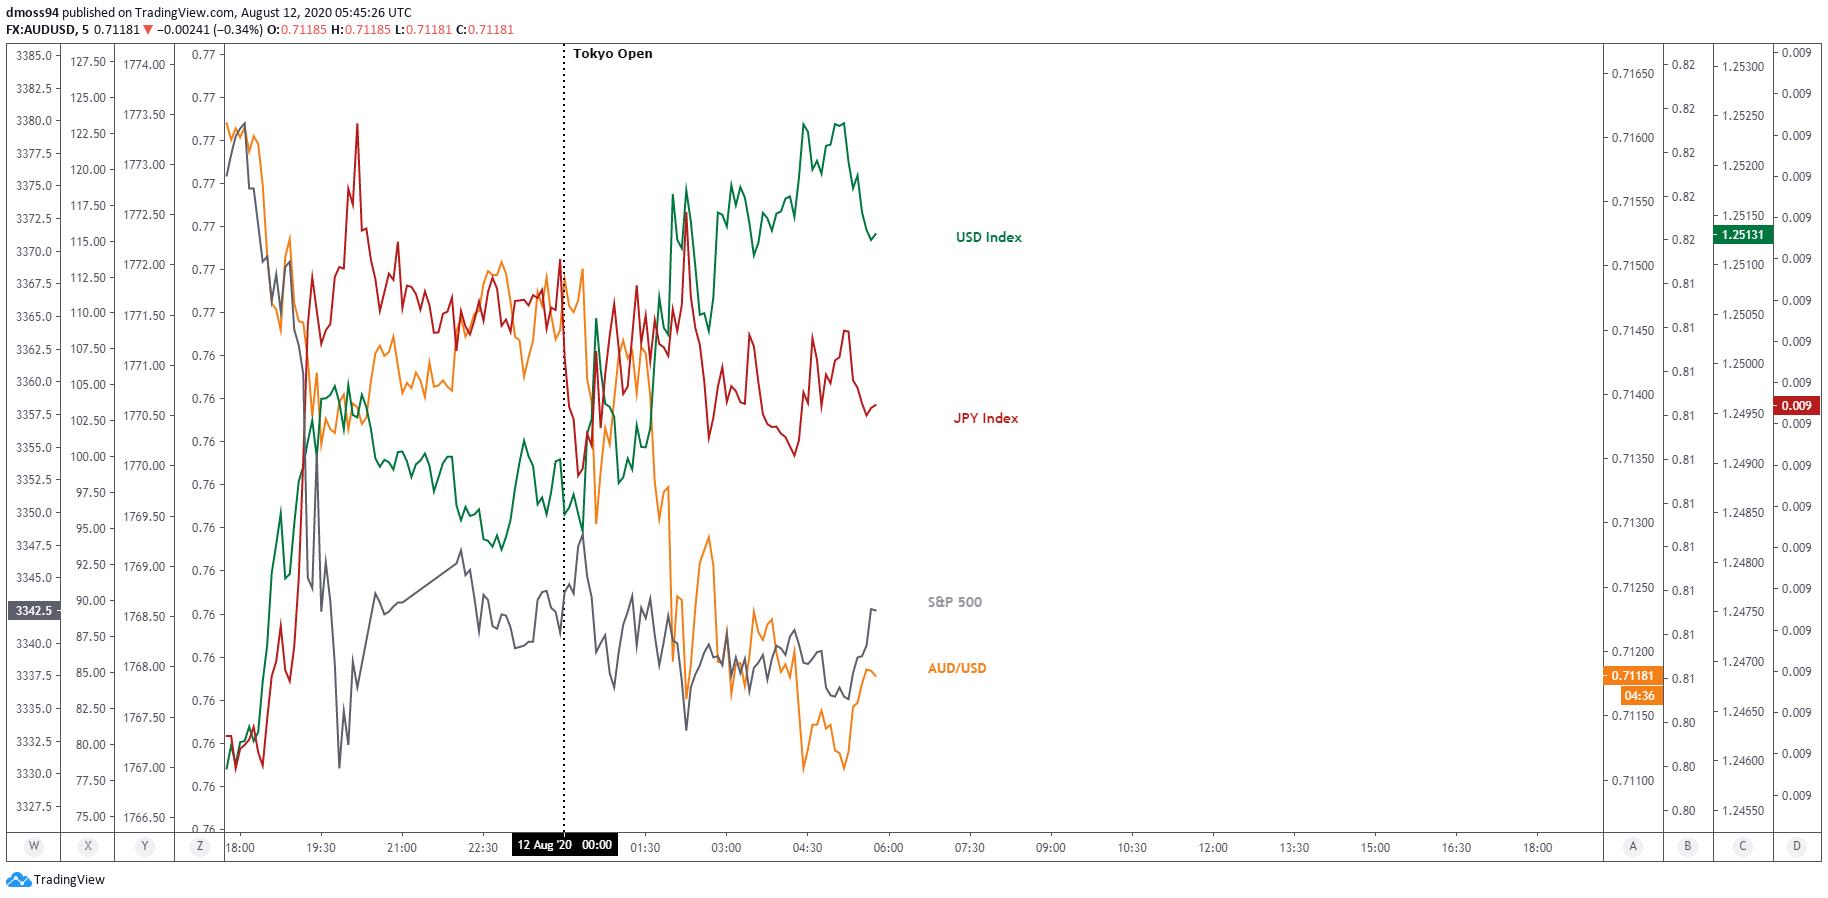
Market data chart created using TradingView
Positive Investor Confidence May Underpin Euro
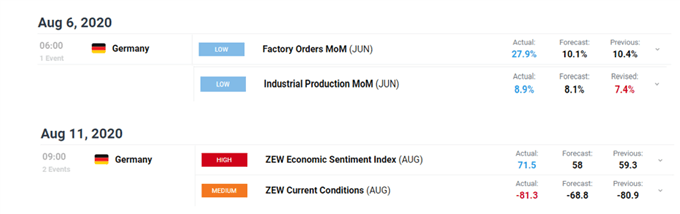
Germany’s ZEW economic sentiment index jumped to its highest level in over 16 years this month, suggesting that the European powerhouse may recover from coronavirus-imposed restrictions faster than originally expected.
This data builds on a 27.9% jump in German factory orders and an 8.9% rise in industrial production in the month of June. Both releases beat market expectations handily and could be reflective of brighter times ahead for the local economy.
However, European Central Bank Chief Economist Philip Lane believes that “while there has been some rebound in economic activity, the level of economic slack remains extraordinarily high and the outlook highly uncertain”.
Therefore, Lane cautions that “it would be unwise to draw strong conclusions from the second quarter outturn [and] when analysing the prospects for the third quarter, the containment of the virus remains the most important factor”.
With that in mind, climbing Covid-19 case numbers may weigh on the Euro and regional risk assets.
Germany has reclassified Spain's capital, Madrid, and the surrounding Basque region as high-risk travel areas, due to rising infection rates.
Further reclassifications and restrictive measures could substantially sour market sentiment and would probably lead to a period of significant risk aversion. Ultimately hampering the performance of the growth-sensitive Euro.
European Daily Covid-19 Cases (YTD)
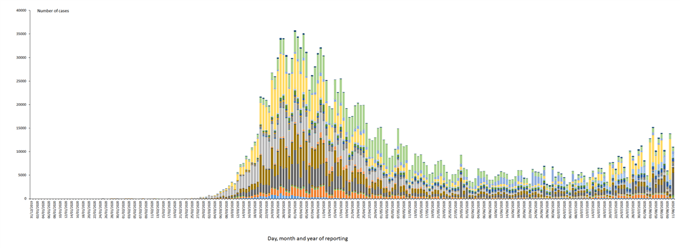
Source – European Centre for Disease Prevention and Control
EUR/USD Daily Chart – Bull Flag or Break-Down?
From a technical perspective, EUR/USD rates continue to consolidate above key psychological support at the 1.17 level. Carving out a potential Bull Flag pattern as price oscillates between support and resistance at the monthly high (1.1916).
However, a break of support could be in the offing should the MACD indicator’s bearish crossover incite further selling pressure.
The RSI also hints at a potential downside break, as the oscillator retreats from overbought territory and begins to test the uptrend extending from the yearly extremes.
Nevertheless, should support at the 1.17 level remain intact, a continuation of the primary uptrend may likely eventuate.
With a daily close above the August high (1.1916) needed to validate the bullish continuation pattern, and open a path for price to test the 2017 high weekly close (1.2035).
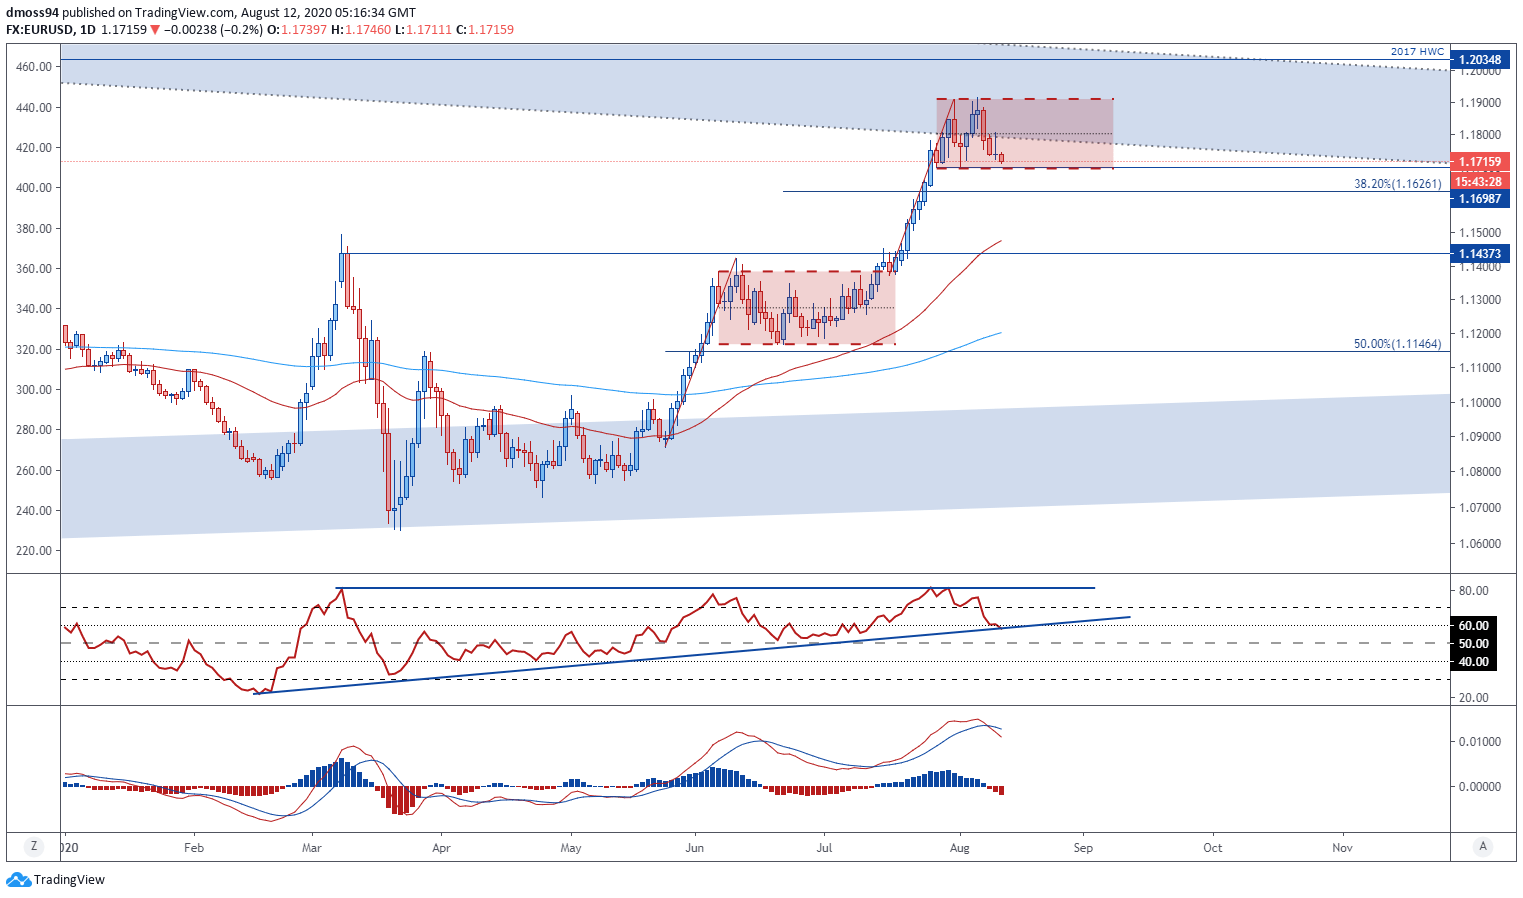
EUR/USD daily chart created using TradingView
EUR/USD 2-Hour Chart – Divergence Hints at Topside Push
Zooming into a two-hour chart highlights the potential for a rebound in EUR/USD rates, as the RSI fails to follow price to lower lows.
Support at the 200-period moving average (1.1703) appears to be providing a supportive base for price and could direct EUR/USD higher as the MACD indicator eyes a cross back above its ‘slower’ signal line counterpart.
With that in mind, a push to test the 50-MA (1.1773) may likely eventuate in the near term, with a break above the psychologically imposing 1.18 level opening a path for price to test the monthly high (1.1916)
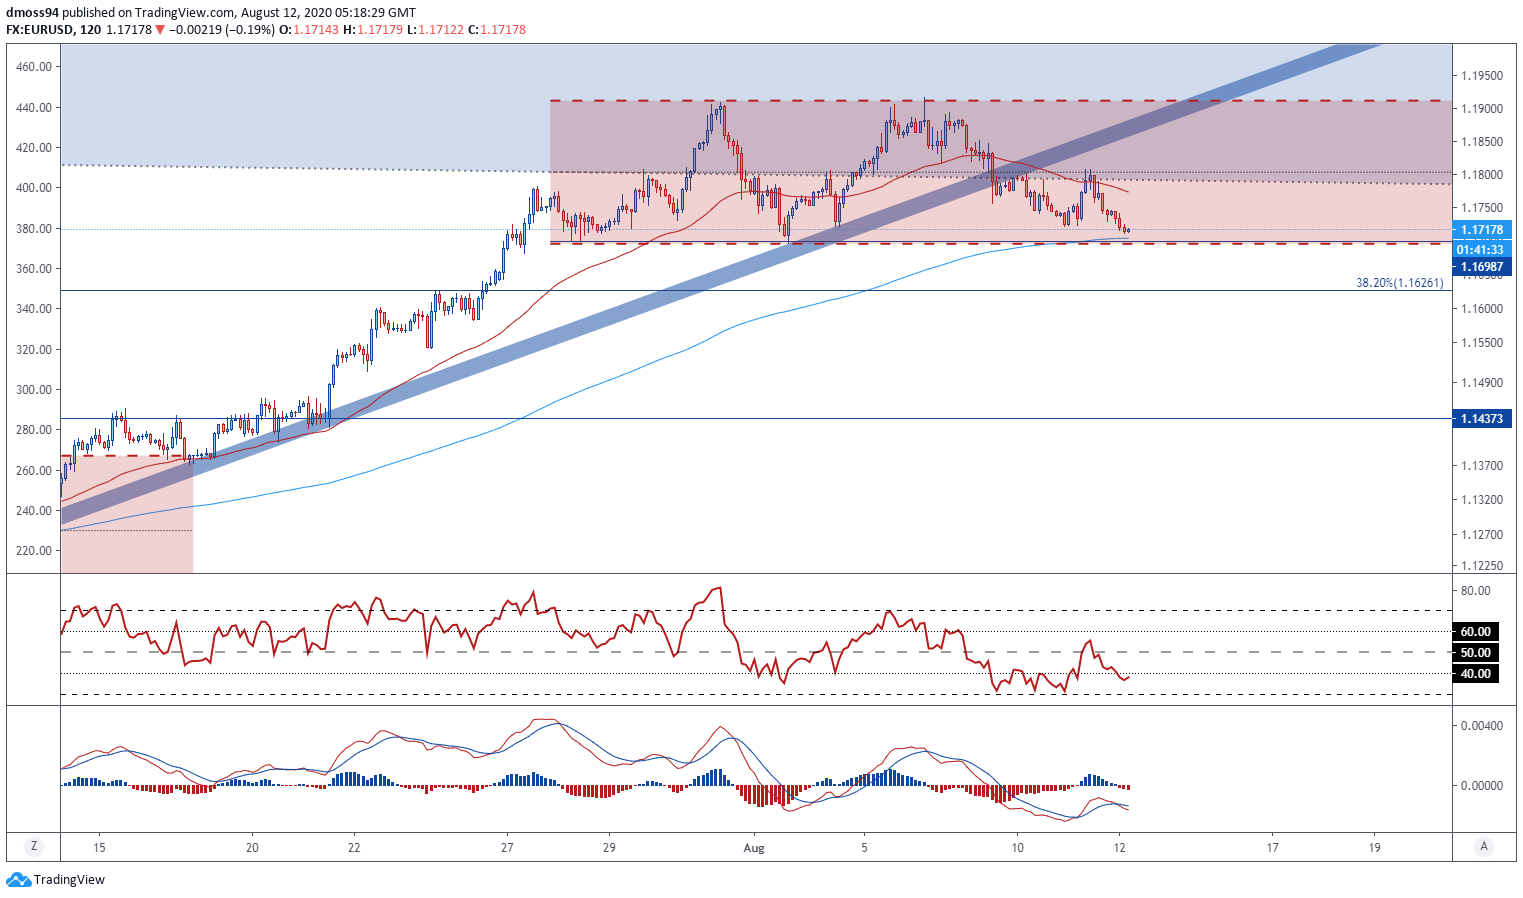
EUR/USD 2-hour chart created using TradingView
| Change in | Longs | Shorts | OI |
| Daily | -9% | -2% | -7% |
| Weekly | -15% | 37% | -2% |
-- Written by Daniel Moss, Analyst for DailyFX
Follow me on Twitter @DanielGMoss


