


EUR/USD, EU Stoxx 50 Index, EU Recovery Fund – Talking Points:
- Risk appetite carried over into Asia-Pacific trade despite global coronavirus cases continuing to climb.
- EUR/USD topside break of Bull Flag pattern hints at push to fresh yearly highs.
- EU Stoxx 50 index remains capped by 200-DMA as investors look to the European Union’s ‘special summit’ on July 7.
Asia- Pacific Recap
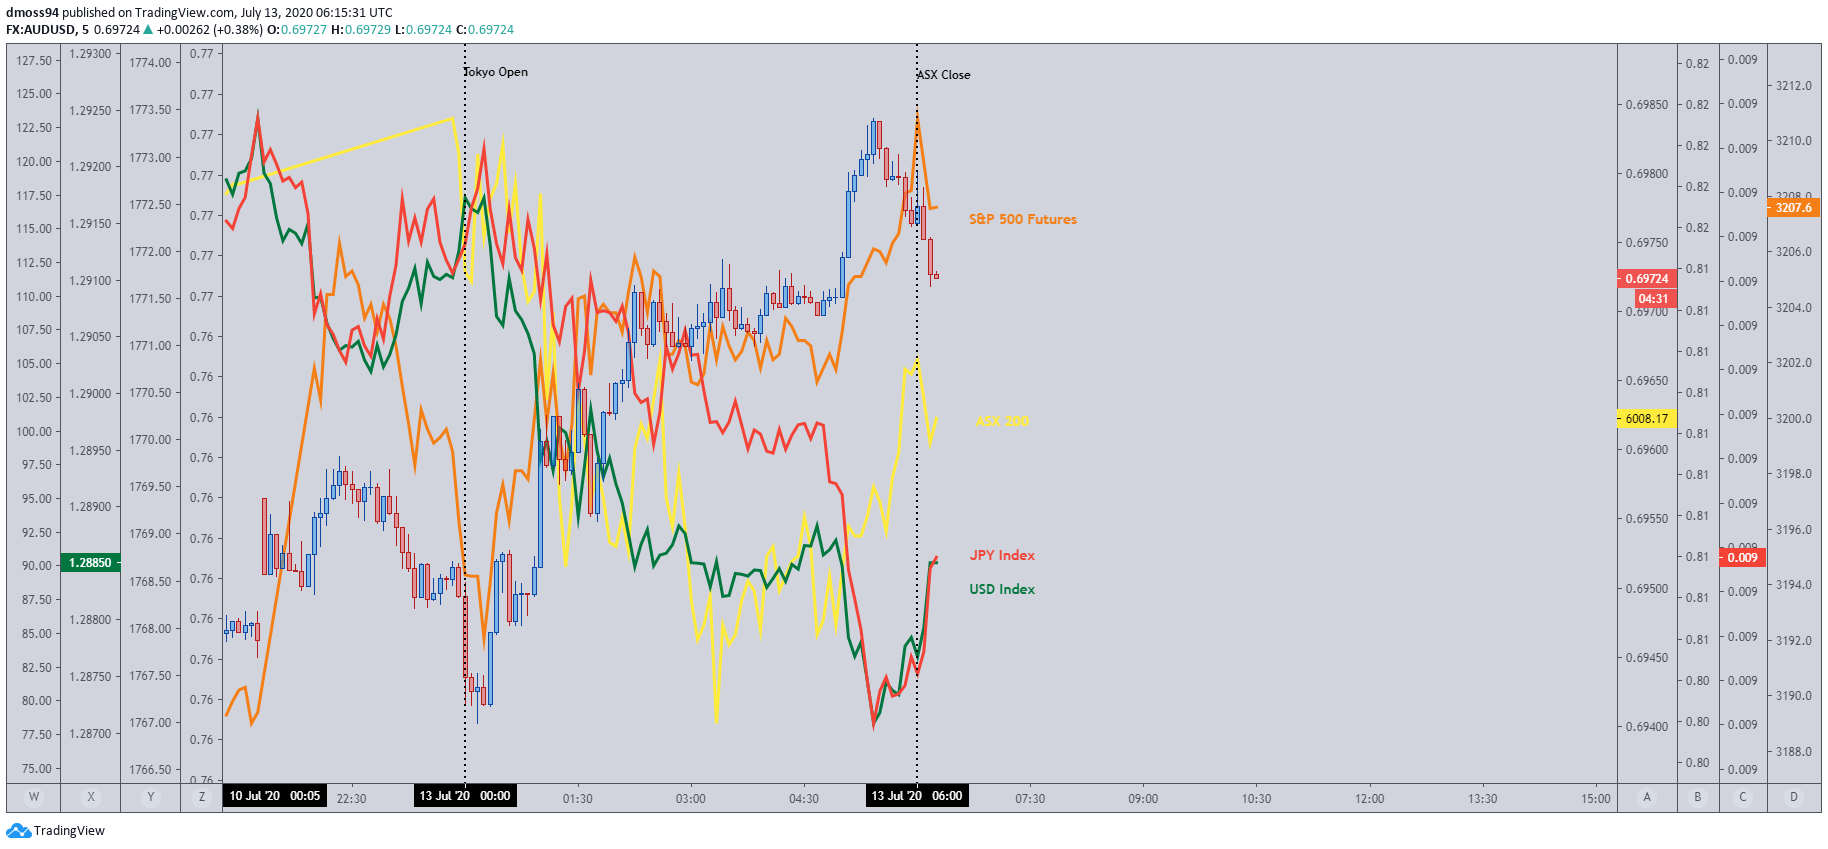
Positive sentiment seemed to carry over from Friday’s Wall Street session as the haven-associated Japanese Yen and US Dollar continued to slide during Asia-Pacific trade.
The trade-sensitive Australian Dollar pushed back towards 0.70, following S&P 500 futures higher as market participants dismissed coronavirus concerns, despite 15,300 new coronavirus cases recorded in Florida – the biggest one-day rise registered in the US.
Copper surged to fresh yearly highs buoyed by USD weakness, supply chain issues and improving fundamentals. Silver followed suit, breaking above the $19 mark for the first time since September 2019.
Looking ahead, US corporate earnings may ignite volatility as investors gauge the damage done at the hands of coronavirus lockdown measures, during the second quarter of 2020.
EUR/USD, EU Stoxx 50 Index Hinge on Recovery Fund Talks
As noted in previous reports, The European Union’s ‘special summit’ on July 17 may fuel regional risk appetite, should European Council President Charles Michel prove successful in culturing unanimous approval of a further €750 billion of fiscal stimulus.
Although “these are very complex negotiations,” Michel believes “it’s important not to wait [as] in the next weeks and months we will face more unemployment in many member states [and] observe bankruptcies with social consequences”.
Stressing the importance of making “a quick decision” to send a “strong signal” of support to member nation’s economies Michel has made notable concessions to sweeten the deal for the “Frugal Four” nations, who have proved the least enthused by the proposed ‘recovery fund’.
In allocating 30% of the upcoming 2021-27 budget to climate related projects, and implementing rebates for net-payer states, Michel seems to be pulling out all the stops to get this deal across the line.
However, with all 27 member states needing to unanimously agree, it remains to be seen if these latest concessions will suffice.
To that end, regional risk assets may continue to trek higher should Michel prove successful, with the EU Stoxx 50 index and EUR/USD exchange rate potentially climbing to fresh post-crisis highs.
EU Stoxx 50 – 200-Day Moving Average Capping Bullish Potential

EU Stoxx 50 index daily chart created using TradingView
From a technical perspective, the outlook for the EU Stoxx 50 index remains skewed to the upside as price tracks within a bullish ascending Schiff Pitchfork.
Buyers may be eyeing a potential break above the 200-day moving average (3,360) and June high (3,399) as price holds above key support at the 61.8% Fibonacci (3,256).
The development of the RSI could validate bullish price action should it continue to track the uptrend extending from the March extremes, with a push above 60 probably coinciding with a surge to fresh monthly highs.
With that in mind, a daily close above the June high (3,399) may stoke regional equity investors and carve a path back to the March high (3,468) and 78.6% Fibonacci (3,523).
EUR/USD Daily Chart – Topside Break of Bull Flag Suggests a Move to Fresh Yearly Highs

EUR/USD daily chart created using TradingView
The EUR/USD exchange rate’s topside break of Bull Flag resistance implies a potential surge above the yearly high (1.1495), with fulfilment of the measured move resulting in a 5% climb back to the 1.18 level.
This is, of course, not a given with the 2018 downtrend and June high (1.1422) yet to be overcome by Euro bulls.
However, the outlook for the growth-sensitive currency seems overtly positive as the RSI and Momentum indicators tick into bullish territory and price bounces off support at the August 2019 high (1.1250).
A daily close above the June high is needed to validate bullish potential, clearing a pathway back to the yearly high and psychological resistance at the 1.15 level.
Conversely, a break of support at 1.1250 would invalidate the Bull Flag breakout and potentially lead to a retracement back to the 61.8% Fibonacci (1.1167) and 200-DMA (1.1088)
| Change in | Longs | Shorts | OI |
| Daily | 7% | 1% | 4% |
| Weekly | -13% | 29% | 0% |
-- Written by Daniel Moss, Analyst for DailyFX
Follow me on Twitter @DanielGMoss


