


EUR/USD, S&P 500, Federal Reserve Balance Sheet, Europe Open – Talking Points:
- Light volume made for a relatively timid APAC trading session, with risk assets nudging slightly higher
- The Federal Reserve’s balance sheet contracted for the third consecutive week. Could this be hampering the S&P 500?
- EUR/USD remains confined within a Bull Flag pattern although wavering fundamentals may weigh on the exchange rate.
Asia-Pacific Recap
Growth-sensitive currencies outperformed most of their major peers during Asia-Pacific trade, as a shortened trading week brought about less-than-average volume.
The Australian and New Zealand dollars continued to trek higher against their US counterpart whilst the S&P 500 remained relatively unchanged after last night’s better-than-expected jobs report.
With cases of novel coronavirus in the United States recording the biggest one-day increase since May 9, there continues to be an undertone of doubt in financial markets which may carry over into next week’s trade as US market participants return from 4th of July celebrations.
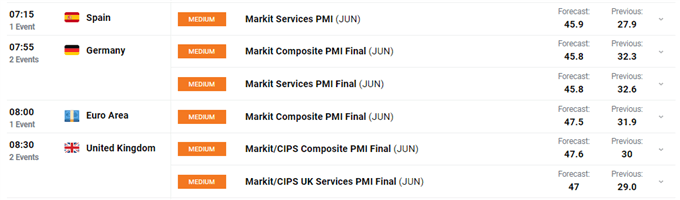
Looking ahead, final revisions of June's Eurozone and United Kingdom PMIs headline a rather light economic docket.
Fed Balance Sheet Contraction Hampering US Equities, Fueling US Dollar?
The S&P 500’s recovery from the low of March has been nothing short of incredible, with prices surging 49% to erase yearly losses and pushing back above the pivotal 3,000 handle.
However, price has since failed to climb above the yearly open (3,237) with many investors pointing to the continued increase of local Covid-19 cases, and US-China trade tensions, as potential headwinds capping further upside.
Although these are substantial fundamental issues, a glance at the Federal Reserve’s balance sheet over the last three weeks may provide the true driving force behind the US benchmark index’s recent lack of impetus.
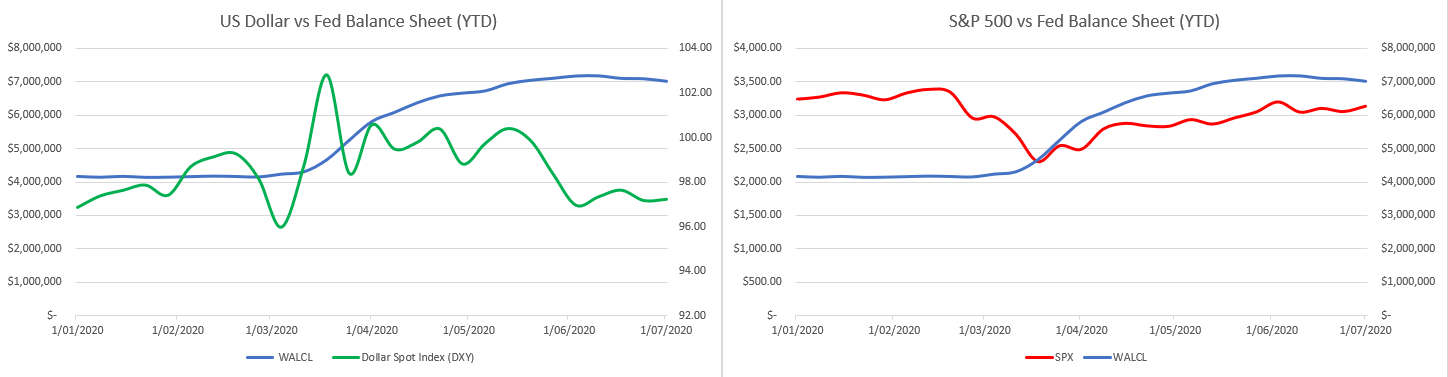
Data Source – Federal Reserve
With the Fed’s balance sheet shrinking 2.3% in the last three weeks, it appears the central bank may have taken their foot off the stimulus gas pedal.
A decline of $73 billion in the week ending July 2 amounts to a total reduction of $160 billion in assets since June 17, coinciding with a notable strengthening of the haven-associated US Dollar as well as a pull-back in the growth-sensitive S&P 500.
Although this recent tapering is but a drop in the ocean - when considering the $3 trillion added to the bank’s books since the start of the year - the optics suggest the monetary backstop holding up US asset prices may be fading.
To that end, the development of this trend over the coming weeks will be keenly watched, as a continued decline may continue to encourage a risk-off bias.
S&P 500 (e-mini) Futures Daily Chart
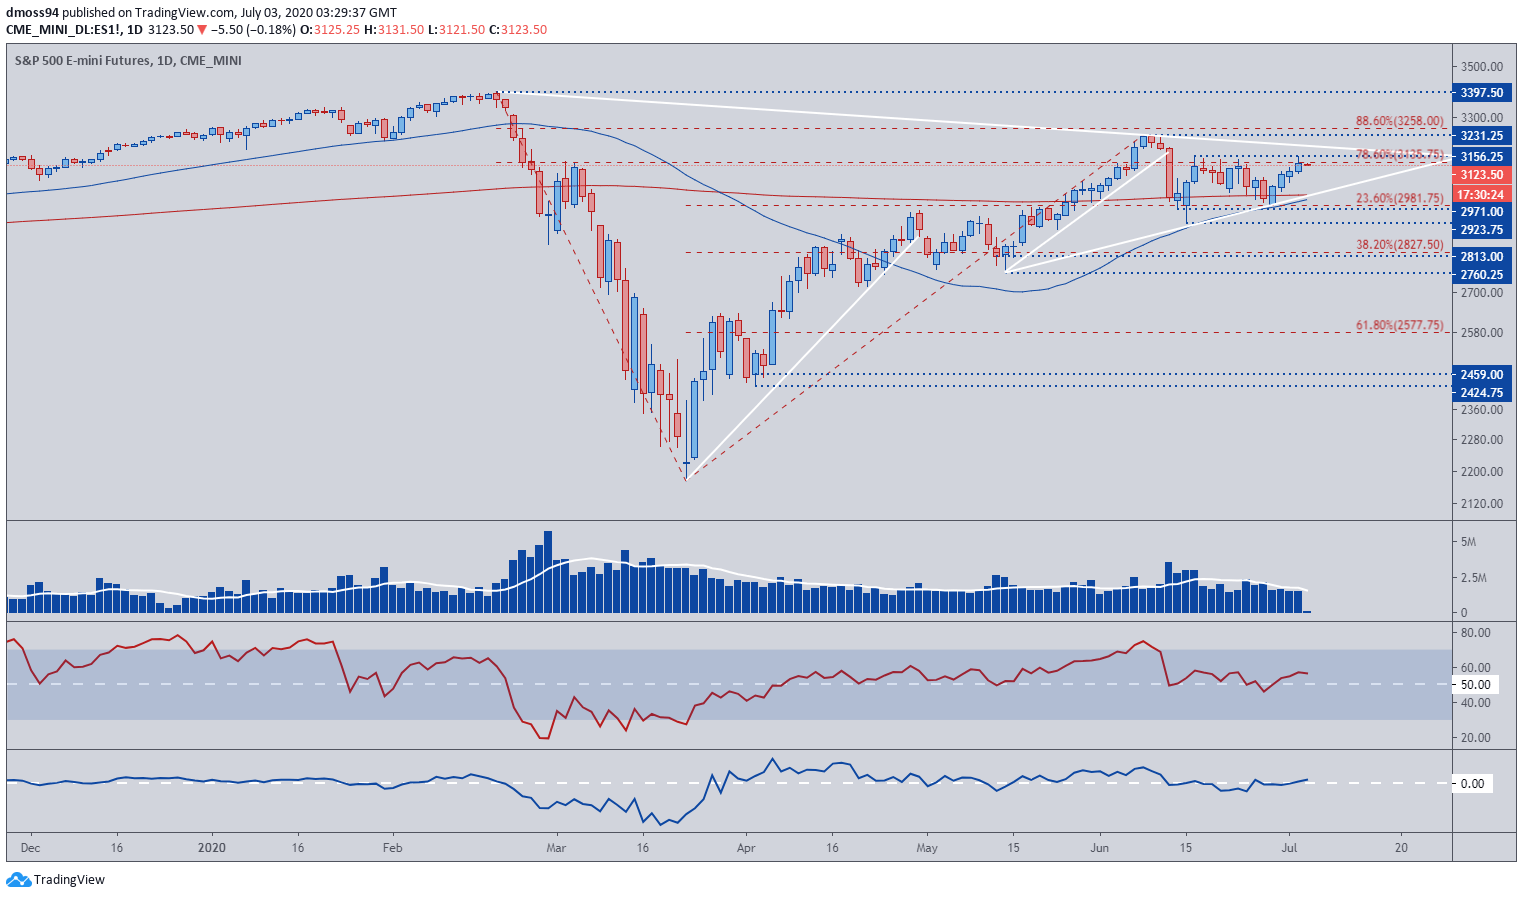
S&P 500 e-mini futures daily chart created using TradingView
From a technical standpoint the S&P 500 remains within a tight 200-point trading range, oscillating between support at the April high (2,965) and 78.6% Fibonacci resistance (3,136).
A period of consolidation seems set to continue with both the RSI and Momentum indicators flatlining at their respective neutral levels, and volume tracking just under its 10-day moving average.
Although the 50-DMA (3,000) appeared to be notably steeping in early-June, recent developments have dampened its topside acceleration reinforcing the potential for a period of sustained consolidation.
Nevertheless, a break above the post-crisis high (3,231) may invigorate buyers as they attempt to push price back to the record high set in late February (3,398).
Conversely, a daily close below the 200-DMA (3,000) and the 23.6% Fibonacci (2,982) may signal the resumption of the yearly downtrend, carving a path for a decline back to the 38.2% Fibonacci (2,827).
| Change in | Longs | Shorts | OI |
| Daily | -5% | -5% | -5% |
| Weekly | 27% | -24% | -6% |
EUR/USD Daily Chart
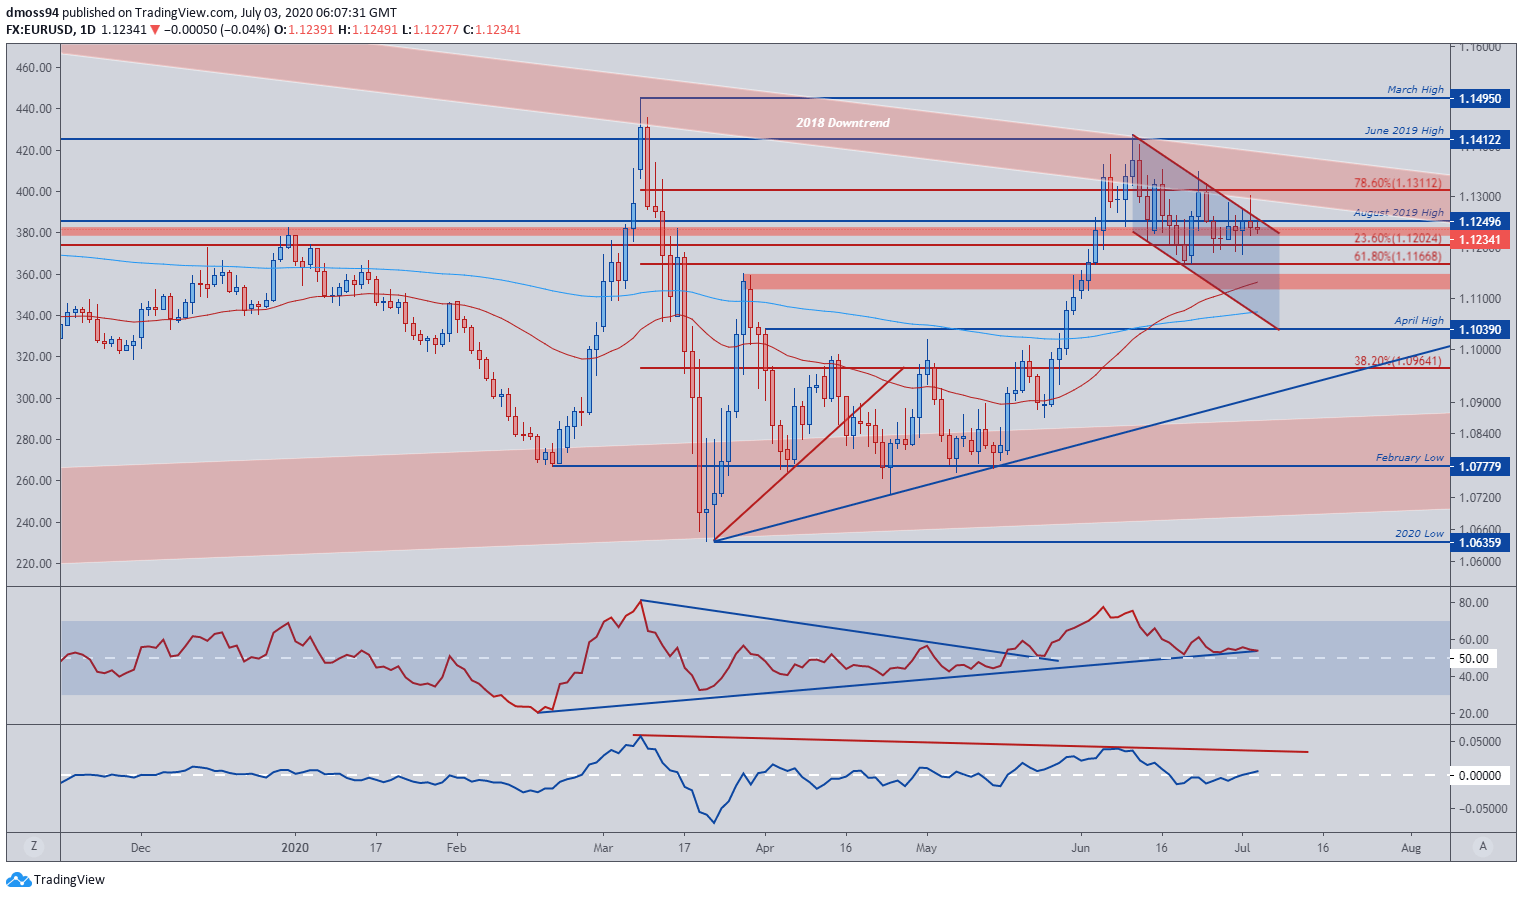
EUR/USD daily chart created using TradingView
Despite tracking in a potential Bull Flag continuation pattern EUR/USD price action hardly looks constructive, as a series of hammer and doji candles form just shy of resistance at the 1.13 handle.
Having said that, the path of least resistance continues to be skewed to the topside as both the RSI and Momentum indicators hover above their respective 50 levels.
A close above the 78.6% Fibonacci (1.1311) is needed to validate a topside break of the Bull Flag formation with a measured move implying a potential surge above the March high (1.1495) may be on the cards.
On the other hand, a daily close below the 61.8% Fibonacci (1.1167) would invalidate the bullish continuation pattern, which may set the stage for a decline back to the 200-DMA (1.1075).
| Change in | Longs | Shorts | OI |
| Daily | 0% | -8% | -3% |
| Weekly | -4% | -4% | -4% |
-- Written by Daniel Moss, Analyst for DailyFX
Follow me on Twitter @DanielGMoss


