


S&P 500, DAX 30, GBP/USD, ECB, Federal Reserve – Talking Points
- Record surge of coronavirus cases in several US states continues to drag on market sentiment
- DAX bounces after the ECB announces lending facility, US-EU trade tensions limit topside move.
- The Federal Reserve’s balance sheet contracted for the second consecutive week. Could that be behind the recent weakness seen in US equity markets?
Asia-Pacific Recap
A relatively subdued day of trade in the Asia-Pacific session saw risk assets nudge marginally higher, as investors contemplated the alarming increase in coronavirus cases in the US, against the backdrop of further monetary stimulus.
The ASX 200 rose after news that private equity firm Bain had struck a deal to purchase Virgin Australia, whilst the cycle-sensitive Australian Dollar crawled higher. Gold retreated from its highest levels since 2012, sliding back under 1,760 alongside yields on US 10-year Treasuries.
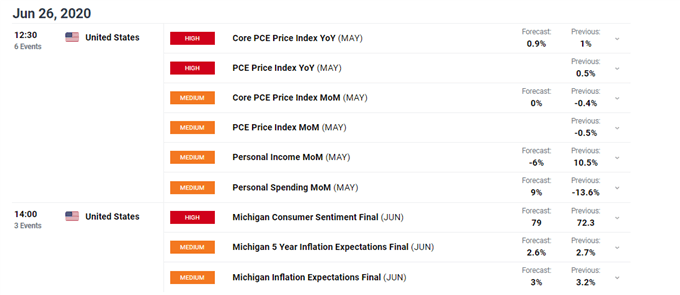
Looking forward, personal income data out of the United States headlines an otherwise sparse economic docket, with expectations of a 9% increase in personal spending, and a 6% decline in income for the month of May.
Coronavirus Concerns, Balance Sheet Contraction Halt S&P 500
Record increase of coronavirus cases in several US states, coupled with weakening fundamentals, has seen the S&P 500 sliding from the yearly open (3,235) back to psychological support at the pivotal 3,000-level.
The decision by Texas Governor Greg Abbott to ‘halt’ the phased re-opening of the state’s economy, as the country records its highest one-day total of new cases in two months, continues to dampen the notion of a return to normalcy absent an adequate vaccine.
Initial jobless claims data compounded the bleak outlook for the economic recovery, exceeding market expectations once again as 1.48 million Americans filed for unemployment benefits, bringing the total number of claims since March 21 to a staggering 47.3 million.
However,this may not be the only cause of the recent weakness in the benchmark equity index as the Federal Reserve’s balance sheet shrank for the second consecutive week, declining a further $12 billion in the week ending June 24.

Data Source – Federal Reserve
Overall the central bank has reduced the size of it balance sheet by $86 billion in the last two weeks, coinciding with the recent decline in the S&P 500 and a slight appreciation in the haven-associated US Dollar.
Although the Fed continues to purchase securities, the magnitude of acquisition has tapered significantly since the extremes seen in March, encouraging the superficial inference that maybe QE is, in fact, limited.
A continuation of this trend could see asset prices struggle to push higher, with a substantial reduction in coming weeks possibly fueling a wave of intensive selling.

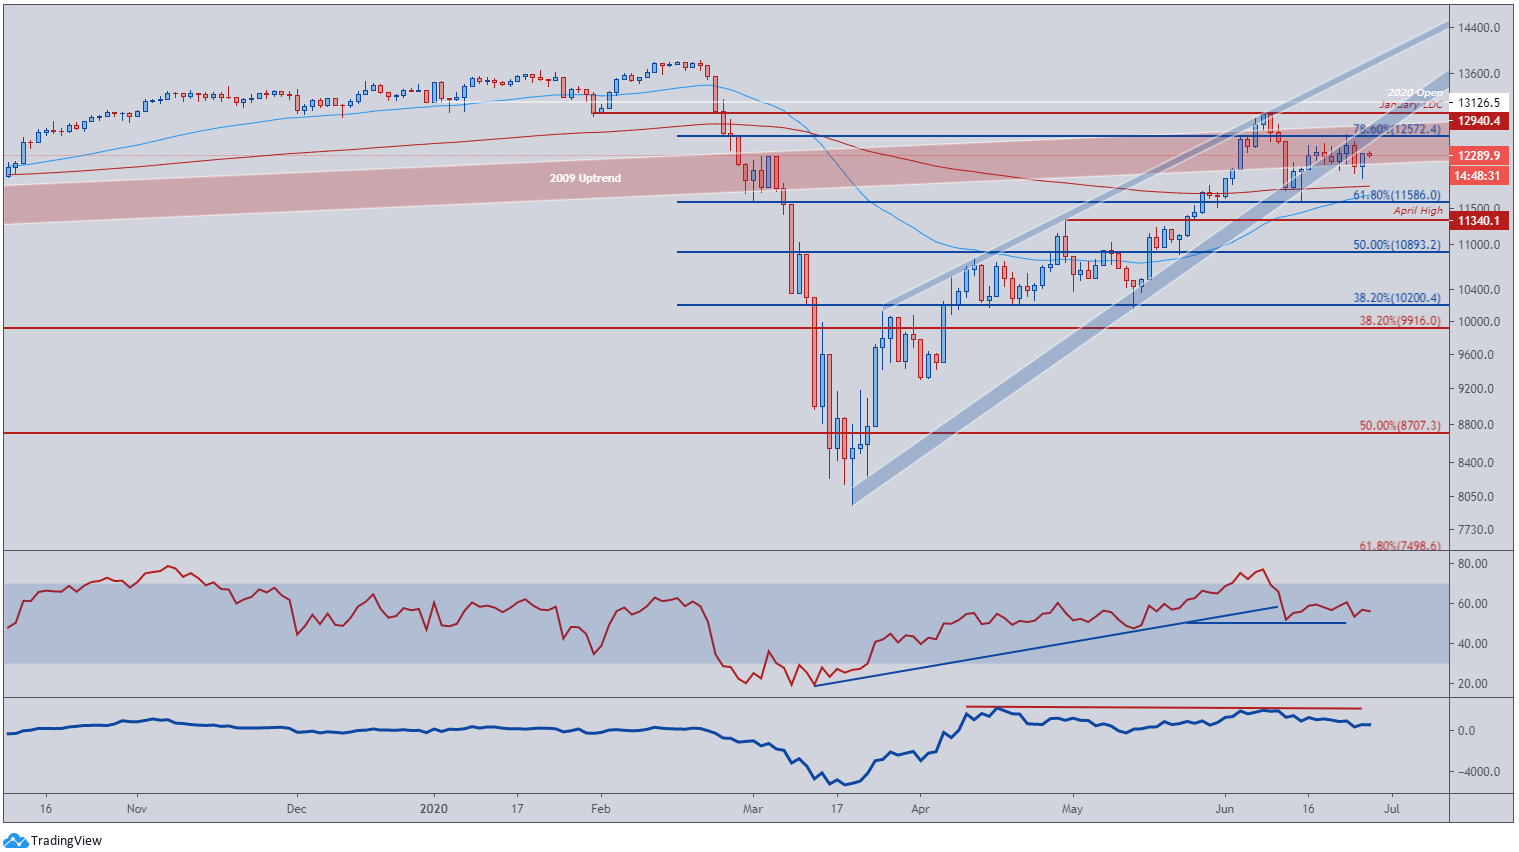
S&P 500 Daily Chart

Source - TradingView
Despite an almighty collapse through the March uptrend on June 11, the S&P 500 has remained stubbornly resilient above the 50- (3,007) and 200-day moving averages (2,980), oscillating in a tight range between the 3,000 and 3,200-handles.
With significant hurdles at the 78.6% Fibonacci and monthly high (3,233) a lack of market breadth, highlighted by falling volume, suggests that further appreciation may be limited.
However, the lack of volume has been omnipresent throughout the recovery, as the benchmark index surged as much as 48% from the yearly low (2,179).
To this end, price action remains the key tell for future directional bias as the RSI indicator flatlines at the neutral reading of 50.
A daily close below pivotal support at the 3,000-handle and 61.8% Fibonacci (2,932) could signify an end to the S&P 500’s monstrous ‘dead-cat bounce’, carving a path for price to push back to key regions of interest at the May low (2,765) and 38.2% Fibonacci support (2,645).
DAX 30 Bounces on ECB Repo Facility
The DAX 30 bounced back above 12,000 last night, spurred on by the introduction of the ‘Eurosystem repo facility’ (EUREP) by the European Central Bank (ECB).
Implemented as a “precautionary backstop” to “address possible euro liquidity needs in case of market dysfunction”, the EUREP program “will provide euro liquidity to a broad set of central banks outside the euro area” complementing the ECB’s existing “bilateral swap and repo lines”.
Unsurprisingly, the news of further monetary stimulus stoked a slight recovery in the German benchmark index although US-EU trade tensions continue to weigh on regional asset prices, capping potential upside.
With the European Union expected to respond to the threat of $3.1 billion worth of tariffs on local exports and the possible imposition of sanctions targeting the Nord Stream 2 gas pipeline, a sustained period of retaliatory exchanges is likely to ensue.
Escalating tensions between the two economic juggernauts would notably add to the uncertainty facing market participants and could fuel further risk aversion.
DAX 30 Daily Chart
Source - TradingView
From a technical standpoint, the DAX is struggling to find a clear directional bias, as it remains trading in a tight range between the 11,500 and 12,500 levels.
A break of Rising Wedge support suggests the path of least resistance remains to the downside, reinforced by the notable injection of sellers at the 78.6% Fibonacci (12,572).
The 200-day moving average (11,822) and 61.8% Fibonacci (11,586) may act as a backstop for price.
However, a daily close below could ignite the resumption of the primary downtrend, carving a path back to a key region of interest at the April high (11,340).
GBP/USD Daily Chart - Struggling at 50-MA Resistance

Source – Trading View
Souring risk sentiment globally has seen the US Dollar rally behind its safe-haven properties, clawing back lost ground against its British counterpart.
A bullish move off support at the 23.6% Fibonacci (1.2355) proved short-lived, with a Bearish Engulfing candle at the 38.2% Fibonacci (1.2547) catapulting GBP/USD back through the 50-day moving average (1.2460).
Resistance at the 38.2% Fibonacci (1.2547) and 200-MA (1.2600) may continue to cap topside potential as bearish divergence on the momentum indicator hints at further downside.
A close below key psychological support at the 1.23-handle could ignite a decline back to the May low (1.2075).
The RSI might be watched intently, as a break of its constructive trend, from the yearly extremes, may provide the trigger for sellers to drive the exchange rate to new monthly lows.
-- Written by Daniel Moss
Follow me on Twitter @DanielGMoss


