


Europe Open, EUR/JPY, EUR/CHF, EUR/USD – Talking Points
- EUR/USD continues its attempts to breach the 2018 downtrend
- EUR/JPY remains contained within a bull flag continuation pattern
- Does EUR/CHF’s tentative recovery suggest improving market sentiment?
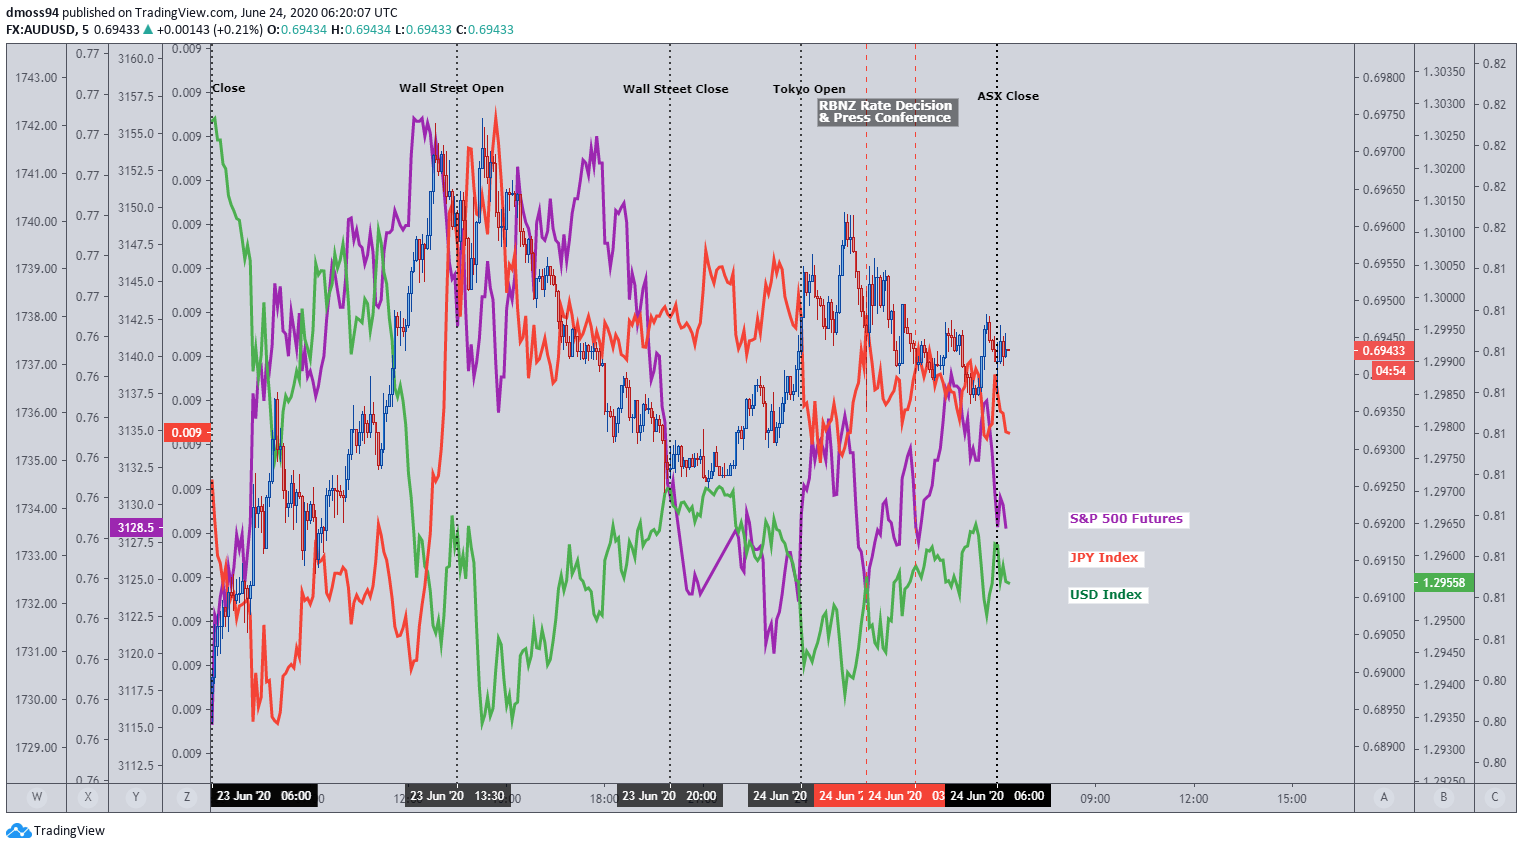
Asia-Pacific Recap
A relatively timid Asia-Pacific session saw US equity futures climb marginally higher, as the haven-linked US Dollar and Japanese Yen slid with a slight risk-on tilt seen to price action.
The Australia Dollar climbed whilst its Trans-Tasman counterpart plunged as the Reserve Bank of New Zealand maintained that “the balance of economic risks remains to the downside”.
Gold surged to its highest levels in 12 years whilst US 10-year Treasury yields rose back above 70 basis points. The Nikkei 225 drifted even as minutes from June’s Bank of Japan meeting signaled policymakers are in wait-and-see mode, with no major changes to the current range of monetary policy programs likely in the near term
Looking forward, the IMF is set to release its 2020 growth projections, which may dampen the recent resurgence in investor confidence.
EUR/CHF Daily Chart – Tentative Recovery Suggests Improving Sentiment
The EUR/CHF exchange rate has been a proxy of investor sentiment for much of 2020, with the rally from the May low (1.0503) coinciding with a global recovery in risk-associated assets.
The return of risk aversion earlier this month ended the Euro’s 16-day surge against its Swiss counterpart, as price failed to close above the psychologically imposing 1.09 handle after setting a fresh yearly high (1.0915) on June 5.
However, the reaction of price at the 50-day moving average (1.0652) and 61.8% Fibonacci (1.0661) suggests that positivity may begin to seep back into financial markets, as the RSI tracks its constructive trend extending from early January.
The momentum indicator may define future direction as it fades to test monthly support, with inability of the oscillator to remain constructive possibly showing that selling pressure has been ignited.
Should price continue to remain supported by the preliminary uptrend from the yearly low, a push back to the 200-MA (1.0753) and 38.2% Fibonacci could eventuate, possibly signalling further upside in global risk assets.

Source – TradingView
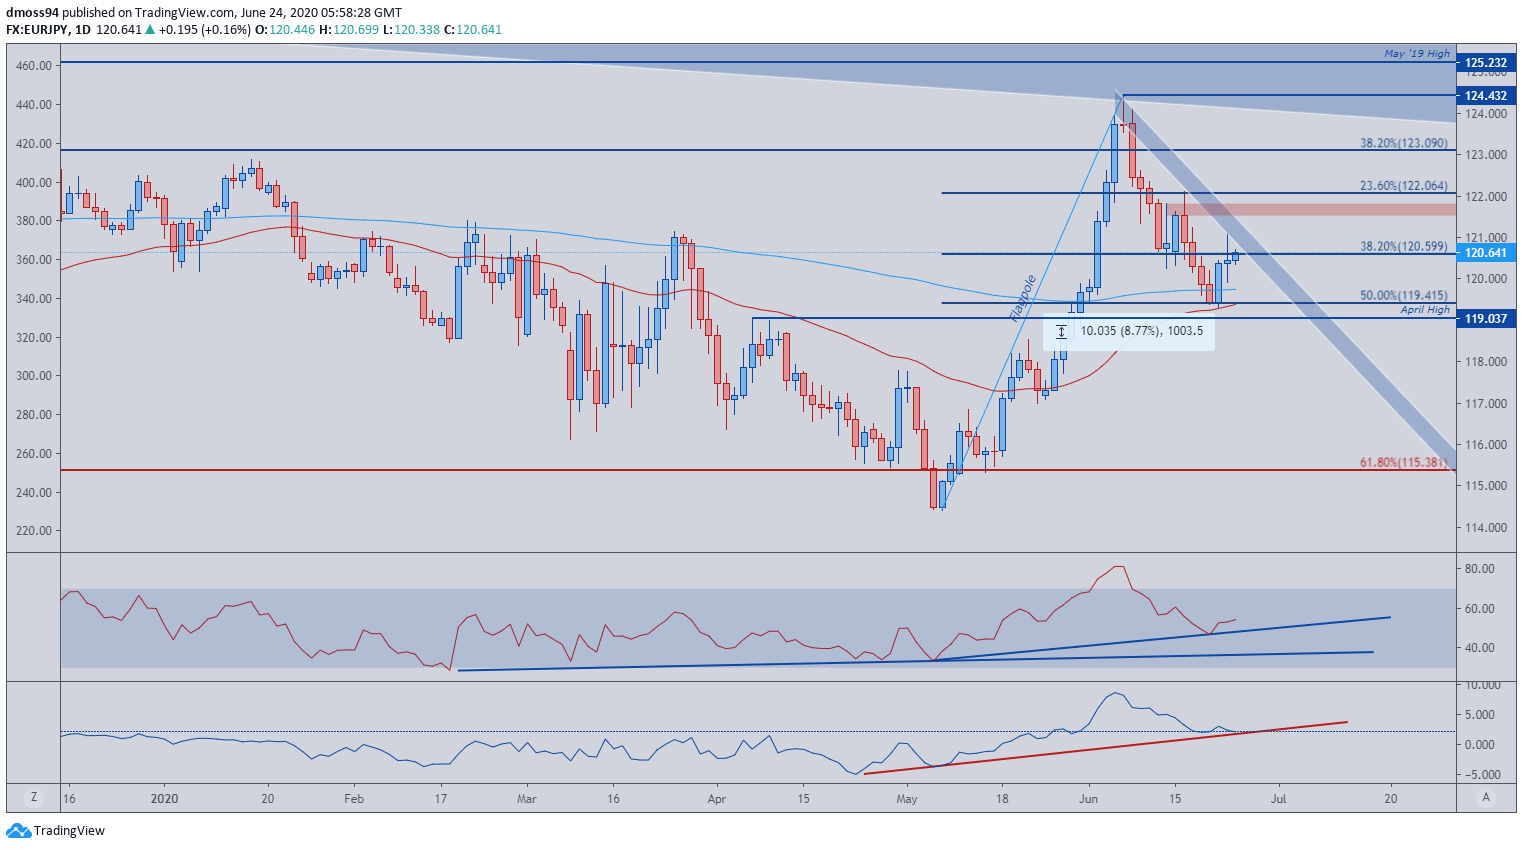
EUR/JPY Daily Chart – Bull Flag Formation Could Fuel Upside Breakout
A bull flag formation hints at a potential topside breakout of the growth-sensitive Euro against the haven-linked Japanese Yen, as price bounces off support at the 50% Fibonacci invalidation level (119.42).
The U-turn of the RSI at 50 (a cross below suggesting bearish bias) could encourage buyers, as price pushes to test the 38.2% Fibonacci (120.60) and the steep downtrend from the yearly high (124.43).
A break and close above trend resistance could lead the EUR/JPY exchange rate to surge back to the yearly high (124.43) should price clear significant hurdles at the 23.6% (122.06) and 38.2% Fibonacci levels.
However, the development of the RSI and momentum indicators remains pivotal, as a break of their respective trends could see price slide rapidly back to support at the April high (119.04) and 50-MA (119.35).
Source – TradingView
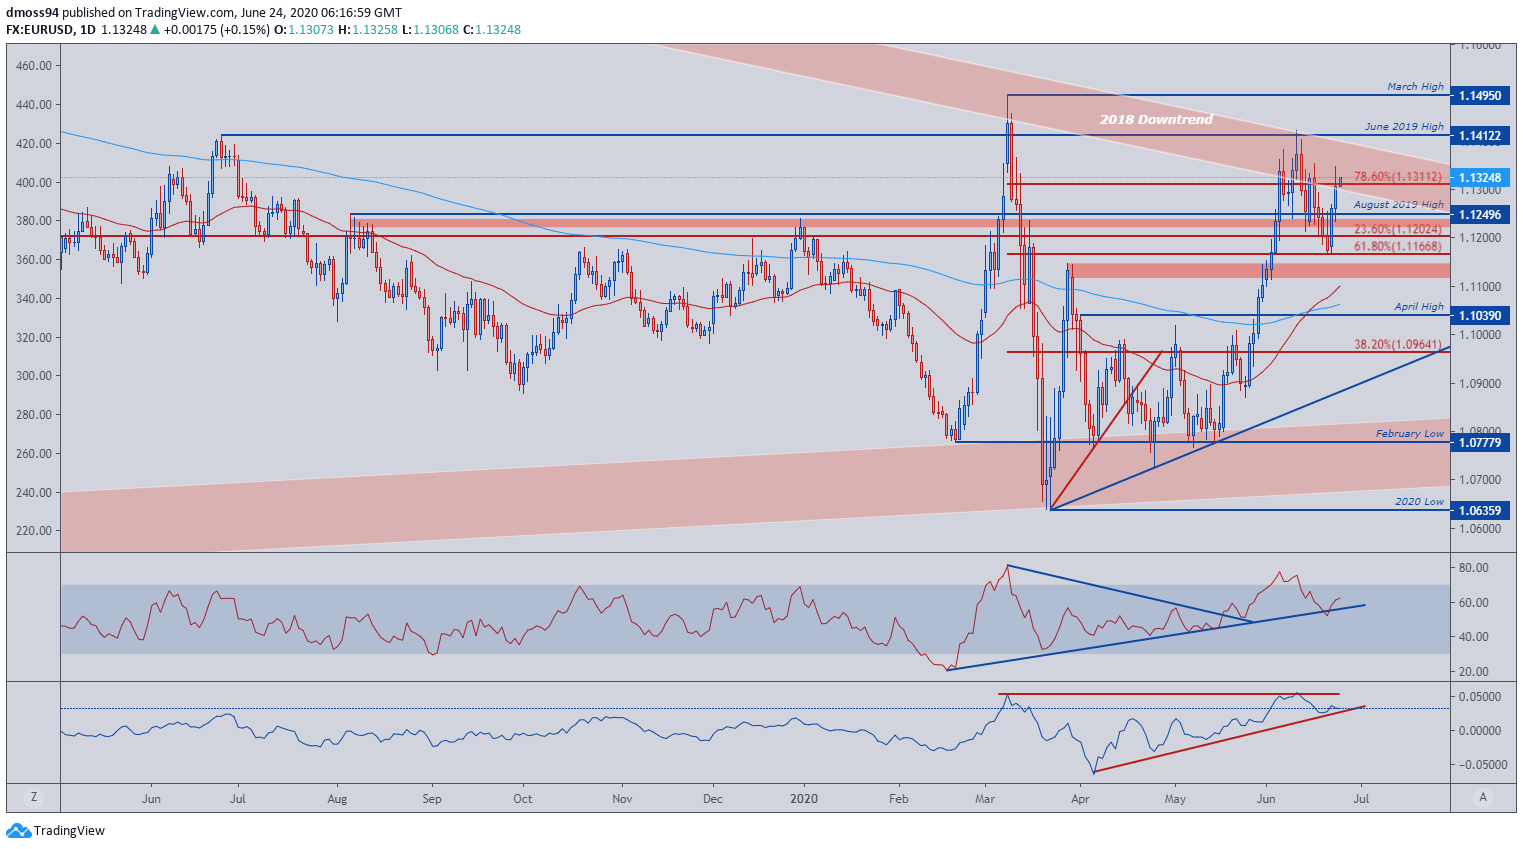
EUR/USD Daily Chart – 2018 Downtrend Continues to Prove Insurmountable
EUR/USD remains stubbornly resilient, as buyers continue in their attempts to drive price through the 2018 downtrend and June 2019 high (1.1412).
Despite a false break of uptrend support, the RSI remains constructive as price crawls back above the August 2019 high (1.1250), suggesting a possible re-test of the monthly high (1.1422).
An entry of the oscillator back into overbought territory may fuel the necessary momentum needed to finally penetrate the 2018 downtrend.
Should prices overcome the June 2019 high (1.1412), the next significant hurdle for buyers to overcome falls at the March high (1.1495), with a breach possibly carving a path to set fresh 2-year highs.
Source - TradingView
-- Written by Daniel Moss
Follow me on Twitter @DanielGMoss


