


TALKING POINTS – YEN, AUSSIE DOLLAR, CHINA PMI, EUROZONE GDP, S&P 500
- Australian Dollar led commodity FX lower on soft China PMI data
- Global slowdown fears may swell if Eurozone GDP data disappoints
- S&P 500 technical positioning warns of broad-based risk aversion
The Australian Dollar led commodity bloc currencies downward while the anti-risk Japanese Yen, Swiss Franc and US Dollar traded higher, echoing a defensive mood on most Asia Pacific stock exchanges. Traders’ downbeat disposition follows the release of disappointing Chinese PMI data, which appeared to stoke global slowdown fears.
More of the same may be in the cards as first-quarter Eurozone GDP data come across the wires. Baseline forecasts envision a slight pickup, with the economy adding 0.3 percent in the first three months of 2019 versus 0.2 percent previously. A tendency to disappoint relative to expectations on recent regional news-flow opens the door for a soft result however. This may feed risk-off dynamics.
Elsewhere, a delegation including USTR Lighthizer and Treasury Secretary Mnuchin will travel to Beijing to continue US-China trade negotiations. The Trump administration’s top economic advisor Larry Kudlow hinted that the outlines of a deal may emerge as soon as the coming two weeks. Markets have mostly shrugged at the passage of recent milestones in bilateral talks however.
What are we trading? See the DailyFX team’s top trade ideas for 2019 and find out!
CHART OF THE DAY – SIGNS OF S&P 500 TOP BOLSTERED BY SHOOTING STAR CANDLE
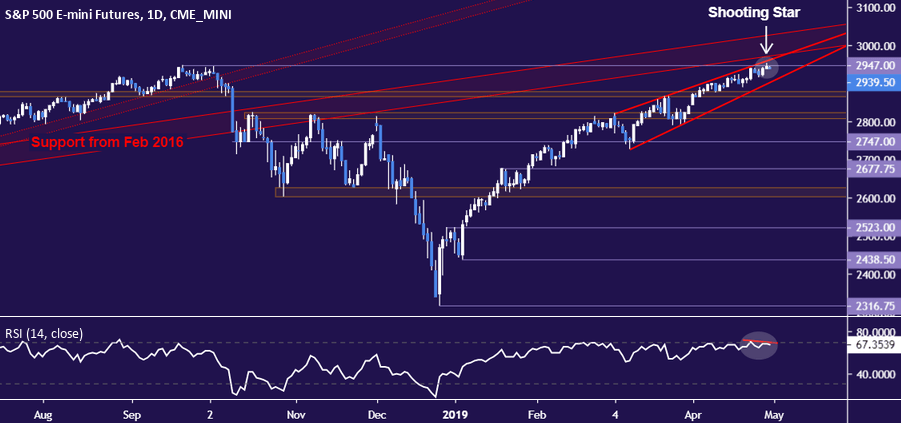
The bellwether S&P 500 daily chart continues to develop signs of topping, warning of market-wide risk aversion on the horizon. Prices conspicuously failed to hold above resistance marked by the 2018 high at 2947, retreating into Monday’s session close to form a textbook Shooting Star candlestick.
This coupled with negative RSI divergence hints at ebbing upside momentum, which may precede reversal. Seeing this appear at the confluence of multiple resistance levels – the underside of broken support from February 2016, the 2018 top and the upper bound of a Rising Wedge pattern – reinforces bearish cues.
FX TRADING RESOURCES
- Just getting started? See our beginners’ guide for FX traders
- Having trouble with your strategy? Here’s the #1 mistake that traders make
- Join a free Q&A webinar and have your trading questions answered
--- Written by Ilya Spivak, Currency Strategist for DailyFX.com
To contact Ilya, use the comments section below or @IlyaSpivak on Twitter


