


CRUDE OIL & GOLD TALKING POINTS:
- Crude oil prices suffer the longest losing streak in 20 months
- Gold prices decline as bond yields tick higher alongside stocks
- EIA inventory data due, S&P 500 futures hint at risk-on lean
Crude oil prices slumped, suffering the seven consecutive day in the red to make for the longest losing streak since April 2017. That followed an EIA report predicting the biggest increase in US oil production on record in 2018. API data showing inventories added a hefty 7.83 million barrels last week reinforced the move. Gold prices edged lower as yields rose in risk-on trade, sapping the appeal of non-interest-bearing assets.
CRUDE OIL EYES INVENTORY DATA, GOLD MAY FALL AS YIELDS RISE
Looking ahead, the spotlight turns to official DOE inventories data. Forecasts envision an increase of 1.63 million barrels, with an outcome closer to the API projection threatening to compound downside pressure. Gold may continue to suffer in the meanwhile as S&P 500 futures point to another risk-on day on the sentiment front, which may keep bond yields on the upswing.
See our guide to learn about the long-term forces driving crude oil prices !
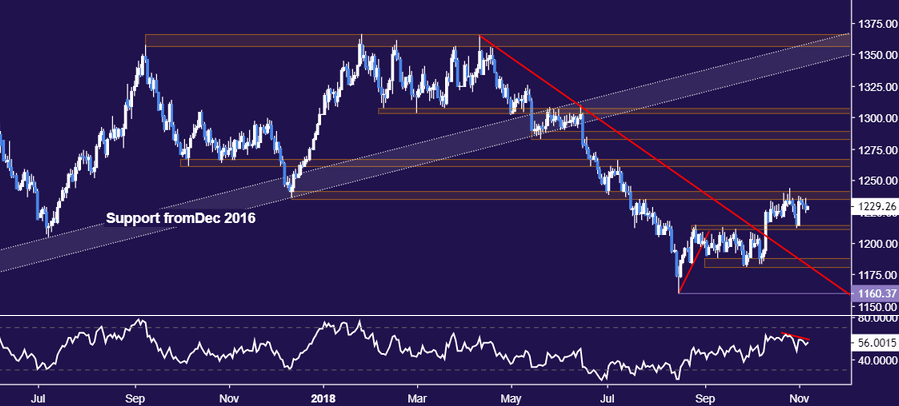
GOLD TECHNICAL ANALYSIS
Gold prices continue to mark time near resistance in the 1235.24-41.64 area. A daily close above this threshold targets the 1260.80-66.44 region next. Alternatively, a turn below support in the 1211.05-14.30 paves the way for a challenge of the 1180.86-87.83 zone.
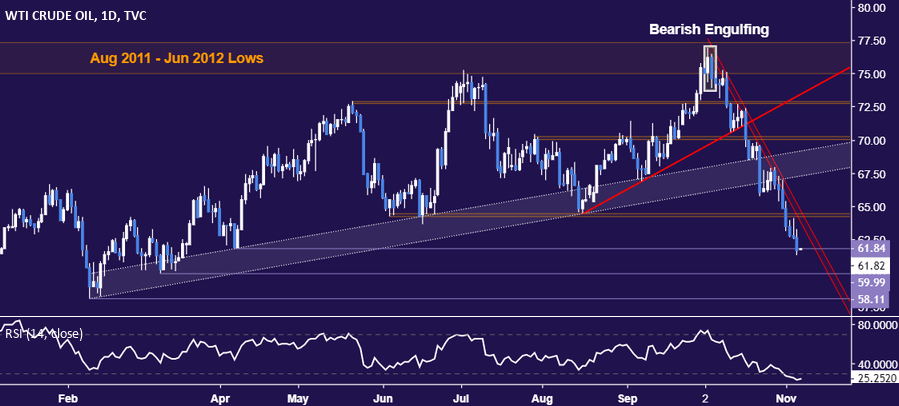
CRUDE OIL TECHNICAL ANALYSIS
Crude oil prices broke support marked by the April 6 low at 61.84, opening the door for a test of the $60/bbl figure. A daily close below that exposes the February 9 bottom at 58.11. Alternatively, a turn back above the 64.26-45 area targets support-turned-resistance at 67.25. Weekly chart positioning hints a major top is set.
COMMODITY TRADING RESOURCES
- Learn what other traders’ gold buy/sell decisions say about the price trend
- Having trouble with your strategy? Here’s the #1 mistake that traders make
- Join a Trading Q&A webinar to answer your commodity market questions
--- Written by Ilya Spivak, Currency Strategist for DailyFX.com
To contact Ilya, use the comments section below or @IlyaSpivak on Twitter


