


US Dollar Talking Points:
- The US Dollar is holding near support after yesterday’s 75 basis point rate hike from the FOMC.
- This morning brought a GDP print to the tune of -0.9% for Q2, following up the -1.6% read from Q1. Tomorrow brings inflation data in the form of PCE and that’s followed by the final read of University of Michigan Consumer Sentiment, on the economic calendar for 10 AM ET.
- The analysis contained in article relies on price action and chart formations. To learn more about price action or chart patterns, check out our DailyFX Education section.
- Quarterly forecasts have just been released from DailyFX and I wrote the technical portion of the US Dollar forecast. To get the full write-up, click on the link below.

The US Dollar remains near support after an action-packed past 24 hours. Yesterday’s FOMC meeting saw the Fed hike rates by 75 basis points for the second consecutive meeting. This wasn’t the 100 basis point move that some were fearing, and the net response after that rate decision was strength in equities to go along with USD-weakness.
This morning brought another major driver to the fray with Q2 GDP, which printed in negative territory again. This was the advance read so it’s subject to revisions, but the print came in at -0.9% which was well-below the expected 0.5% read. It’s not as bad as last quarters -1.6% but, nonetheless, it does show continued deterioration as the Fed has continued to lift rates, and this brings up an important point.
Rate hikes take time to transmit through an economy, and we’re likely still seeing the impact from the Fed’s initial hikes filtering-in. This was something noted by Chair Powell at yesterday’s presser and something that equity bulls really seemed to run with, driven by the prospect of the Fed slowing rate hikes in the coming months should economic data continue to deteriorate. We’re not there yet, of course, but given the move in yields, particularly on the long-end of the curve, it seems that some are beginning to expect as such.
This morning brought a breakdown in US yields as the 10-year pushed down to a fresh three-month-low. This illustrates that theme fairly well, with yields on the longer-end of the Treasury curve falling even as the Federal Reserve hikes rates, helping to boost the short-end of the curve.
I talked about the yield curve in greater depth in the Tuesday article, and if you’d like to read more you’re certainly welcome to check that out. It’s towards the top of the US Dollar Price Action Setups from Tuesday.
US 10-Year Treasuries

Chart prepared by James Stanley; 10 year rates on Tradingview
US Dollar
This seems like a Euro story to me, at this point. I talked about it last week as EUR/USD was grinding into the parity level and given that price’s importance as a psychological level, I think it’s going to take a big push from bears to leave it behind. A 100 basis point rate hike yesterday might’ve done it, as that was a theme of interest when the topic was in the headlines a couple of weeks ago. But more importantly I think we’re going to need to see continued divergence between US and European rate policy.
This can show in one of two ways: Either stronger US data, which alludes to the possibility of a heavier hand from the Fed at the September rate decision. Or, the ECB staying relatively loose and passive even as inflation grows.
On the part of US data, there’s some highlights on the horizon. Tomorrow brings the Fed’s preferred inflation gauge of PCE at 8:30 AM. Then at 10 AM, we get University of Michigan Consumer Sentiment numbers and these have been a focal point of late, following last months print at the 50-level. This month saw recovery in the preliminary ready but tomorrow brings the final print of that figure. And then next week brings Non-farm Payrolls.
The US Dollar is still holding Fibonacci support at this point, around the 38.2% retracement of the June-July major move. Resistance has played-in from around the 23.6% retracement of that same study, highlighting a range that’s been in-play for about a week now.
US Dollar Four-Hour Chart

Chart prepared by James Stanley; USD, DXY on Tradingview
EUR/USD: Still in the Box
On that topic of range-bound price action, I looked at a rectangle formation in EUR/USD on Tuesday. That setup continues to carry interest. There’s been bend at this point, but no lasting breaks and this keeps the door open for breakout potential into tomorrow’s batch of data.
From the daily chart below, sellers have had ample opportunity to push for another re-test of parity. There’s now been resistance inflections at 1.0233 in seven of the past eight days. The fact that bears haven’t posted a bigger break, even as the Fed has added another 75 basis points to US rates, indicates that the pair may still be oversold.
Given the rectangle, that breakout can hit in either direction but there may be a near-term bias towards the bull side of the equation, looking for a breach of short-term resistance of 1.0233 to lead into a test at the top of the box, around 1.0280, after which the prior multi-year low of 1.0340 comes into play as resistance potential.
EUR/USD Daily Chart

Chart prepared by James Stanley; EURUSD on Tradingview
GBP/USD
GBP/USD is continuing to rally, giving further run to the falling wedge formation from two weeks ago and, at this point, the pair is continuing the pattern of higher-highs and higher-lows
As I had looked at on Tuesday, bulls were tepid around tests of resistance or at new highs, leading to the possibility of reversal. There was even a build of a possible falling wedge formation, given that slower activity near resistance. But, after yesterday’s push, the rising wedge has been invalidated and there’s now a further build of higher-highs and higher-lows. Higher-low support potential exists at 1.2090 at this point, and there’s another spot around the 1.2021 Fibonacci level.
GBP/USD Four-Hour Price Chart
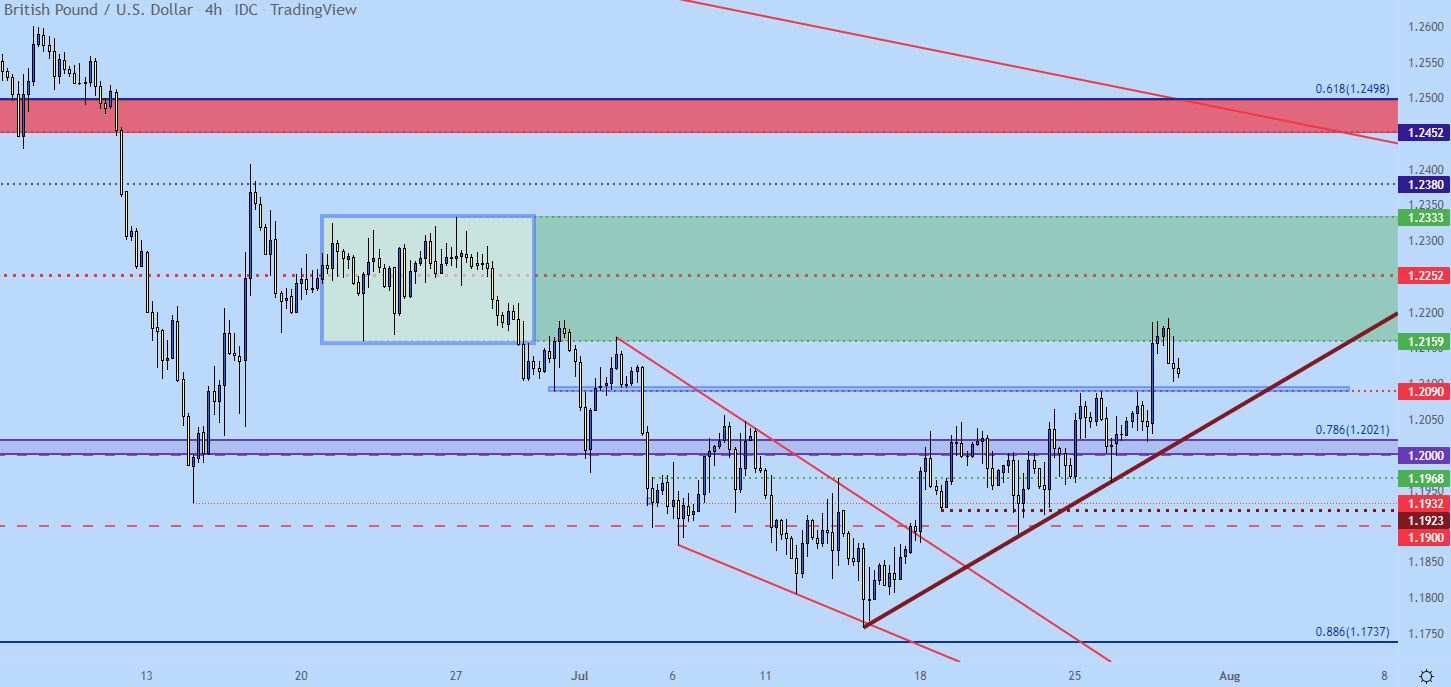
Chart prepared by James Stanley; GBPUSD on Tradingview
USD/CAD Support
Shorter-term USD/CAD looks very messy to me. Longer-term may have some interest, however, particularly for those looking for support scenarios around the US Dollar.
From the weekly chart below, the 33-pip zone in red spanning from 1.2764-1.2797 has been an interesting pivot going back to November of 2020. This zone has helped to hold multiple resistance tests last year and earlier in 2022. More recently, bulls have forced a break and the weekly bar is currently showing a response to the topside of that zone as price action support. That bar doesn’t complete until after tomorrow, but a hold of support at prior resistance could make for a compelling scenario.
USD/CAD Weekly Price Chart

Chart prepared by James Stanley; USDCAD on Tradingview
USD/JPY Breakdown Potential
I opened this article with a note on the 10-year yield as there may be some pertinence here with both USD and JPY themes.
As I had looked at last year when the Fed started talking up 2022 rate hikes, if US rates are moving, the Yen is of interest. As US rates are adjusting higher, with the BoJ holding pat, this adds allure to the topside of USD/JPY as driven by carry trade themes. And as long as US rates are going higher and the BoJ isn’t making any changes, that argument remains strong.
When rates start going the other way, however, look out below. As carry trades get squeezed with falling rates, those trends can unwind very, very quickly. And given the push in yields this morning it would appear that this is starting to take root in USD/JPY.
At this point, the pair is testing support around the 135.00 psychological level but, notably, did set a fresh monthly low this morning.
USD/JPY Eight-Hour Price Chart
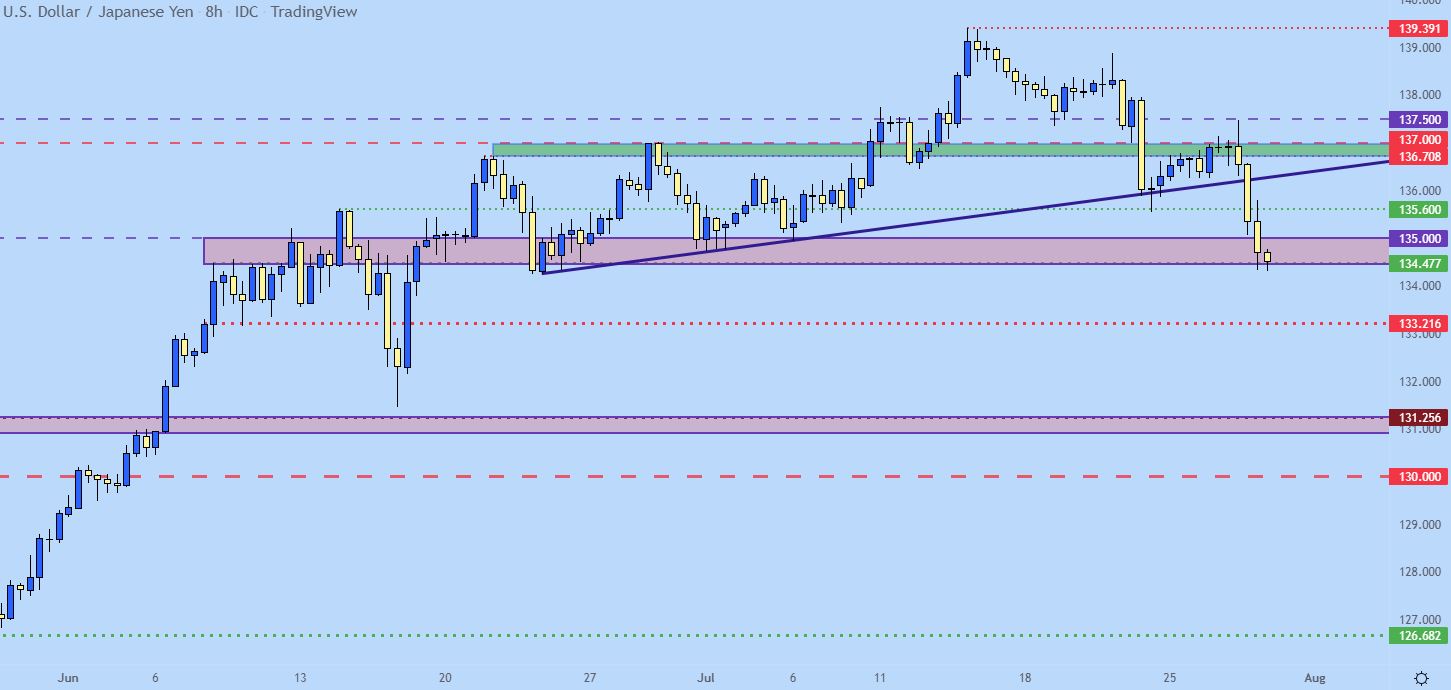
Chart prepared by James Stanley; USDJPY on Tradingview
From the weekly chart below, we can get some context on the matter and there’s a reason why there’s so much interest in Yen-strength themes given how built up those themes of weakness had become.
At this point, there’s a logical argument to correlate risk-off pain, which could drive US yields-lower, as being a positive for the Yen as carry trades undergo further unwind. And, optionally, this is a theme that may remain of interest in other pairings, such as EUR/JPY.
USD/JPY Weekly Chart
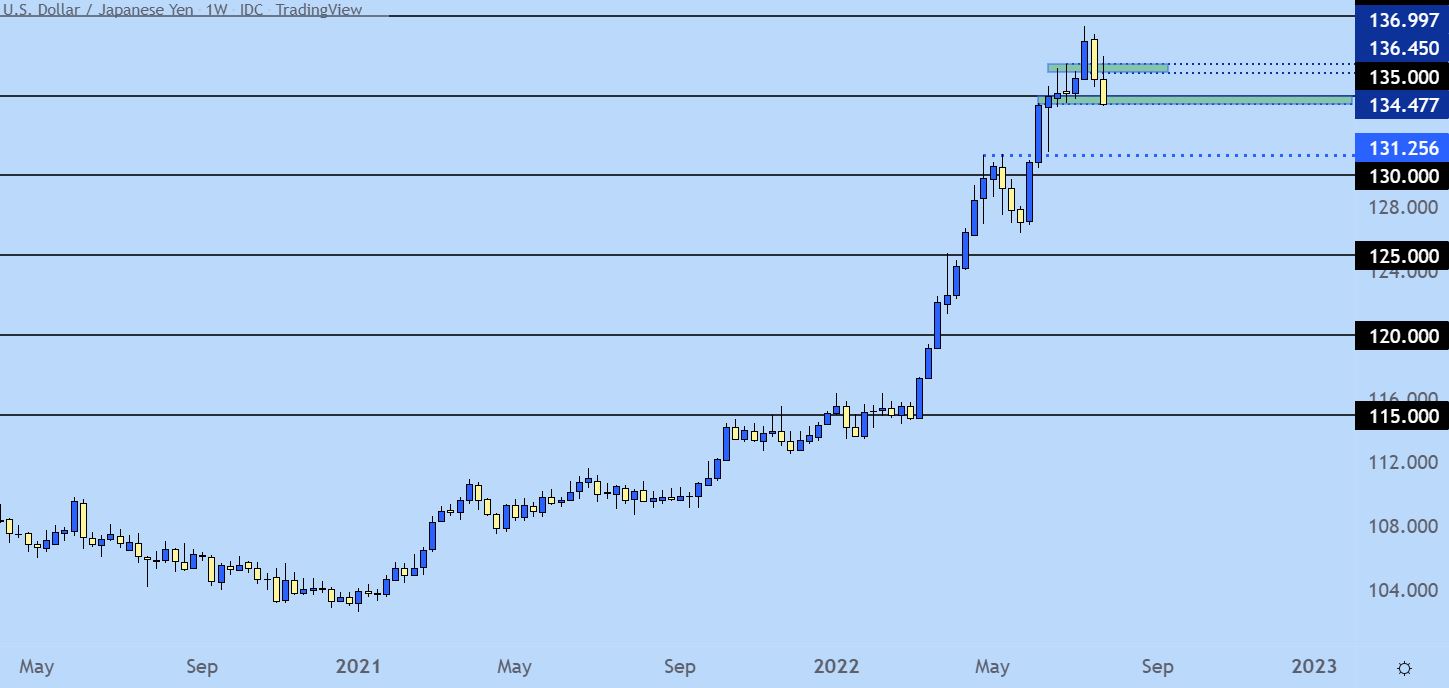
Chart prepared by James Stanley; USDJPY on Tradingview
--- Written by James Stanley, Senior Strategist for DailyFX.com
Contact and follow James on Twitter: @JStanleyFX


