


Euro Talking Points:
- The euro has continued to fall, with EUR/USD crossing the vaulted parity figure on some price feeds. That’s led to a bounce which has already seen some response from sellers.
- Tomorrow brings CPI out of the United States with an expectation for an 8.8% YoY read, which could create even further divergence between the Euro and US Dollar, which could compel a deeper bearish movement.
- The analysis contained in article relies on price action and chart formations. To learn more about price action or chart patterns, check out our DailyFX Education section.

EUR/USD has finally done it, sort of. After 19 years the pair has crossed the vaulted parity figure, depending on the price feed being followed. Because Forex is a decentralized market, pricing can differ across brokers, and some feeds that I’ve looked at this morning have shown a temporary test of parity while others showed the low coming in just above that level at 1.0000.
This is somewhat of the ultimate psychological level and in EUR/USD, this is something that hasn’t happened since December 6th of 2002. Quite a bit has happened since then but perhaps most amazingly, parity remained unfettered throughout the European Debt Collapse when Draghi’s ‘Whatever it takes’ pledge helped to keep the currency from full-on collapse.
Whether that price was hit or not across the various feeds, what happened after tracked as a strong bounce developed. On the below chart, we can see a 70 pip bounce after that parity test earlier this morning, with EUR/USD prices coming very close to the Fibonacci level that had previously helped to set the low. That plots at 1.0072 and it’s the 76.4% retracement of the ‘lifetime move’ in the pair.
And, so far in the early stages of this bounce, there’s even been an item of higher-low support coming in around the 1.0032 level.
EUR/USD 30-Minute Chart
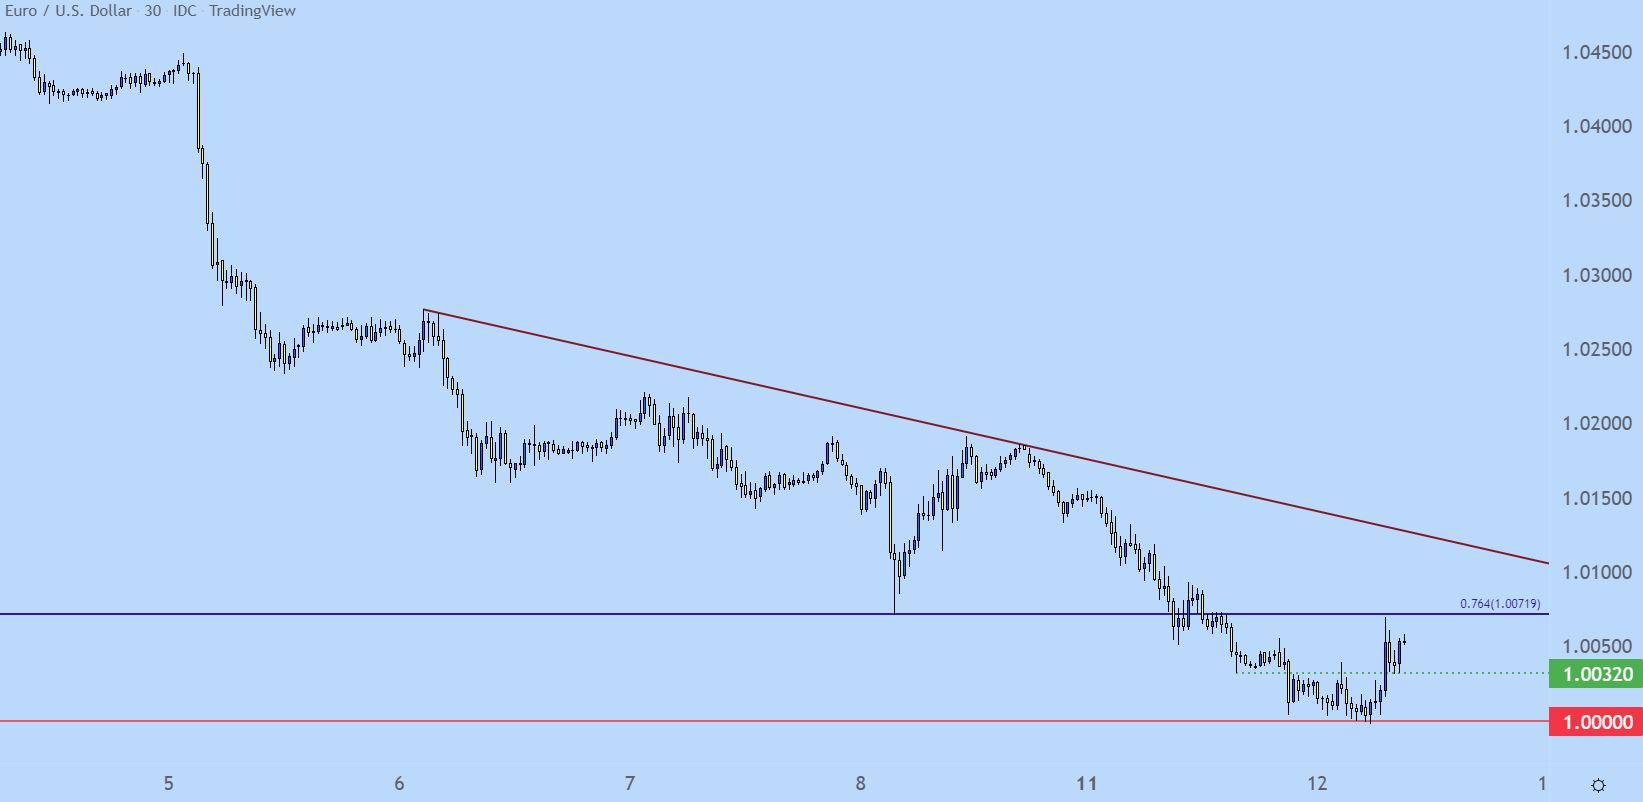
Chart prepared by James Stanley; EURUSD on Tradingview
EUR/USD Pain Trade
The big question now is how far this pullback might run and when sellers might return to the matter for another re-test of the parity figure. And given how price action had expanded on the way down, even as that vaulted parity figure was coming into play, there may be more volatility expansion in the near future.
There certainly exists the drive for such from the economic calendar. Tomorrow brings June CPI numbers out of the US and then next week brings earnings season. The following week brings the FOMC’s July rate decision and, at this point, the bank is expected to hike by another 75 basis points with another 50 on the way in September.
The bigger question on EUR/USD, however, is whether the ECB is getting near any changes in their policy outlay. It was last month’s ECB rate decision, when the bank offered up a 25 basis point hike in July as an initial attempt to soften inflation. With inflation in Europe already above 8% and with the threat of more given the ongoing war in Ukraine, combined with what will show in the coming months on the back of this Euro-weakness, and the question remains how the central bank will navigate what appears to be a treacherous road.
The one thing that’s been clear so far – the ECB doesn’t want to aggressively hike, and this is probably driven by the fear of stalling what growth remains. And given the increasing rate differential in the EUR/USD pair, prices have been falling through the floor as driven by rates. The Euro is vulnerable to further losses until this fundamental picture begins to shift.
Near-term, however, the question remains for how long this bounce might run. There’s resistance potential at that support point at 1.0072 and this would be an aggressive spot to look for bearish setups. A little higher, if a short-squeeze does develop off of that parity test, there’s a prior double top at 1.0191. And if bulls can force a break there, there’s a larger zone sitting overhead from 1.0221-1.0235.
EUR/USD Two-Hour Price Chart
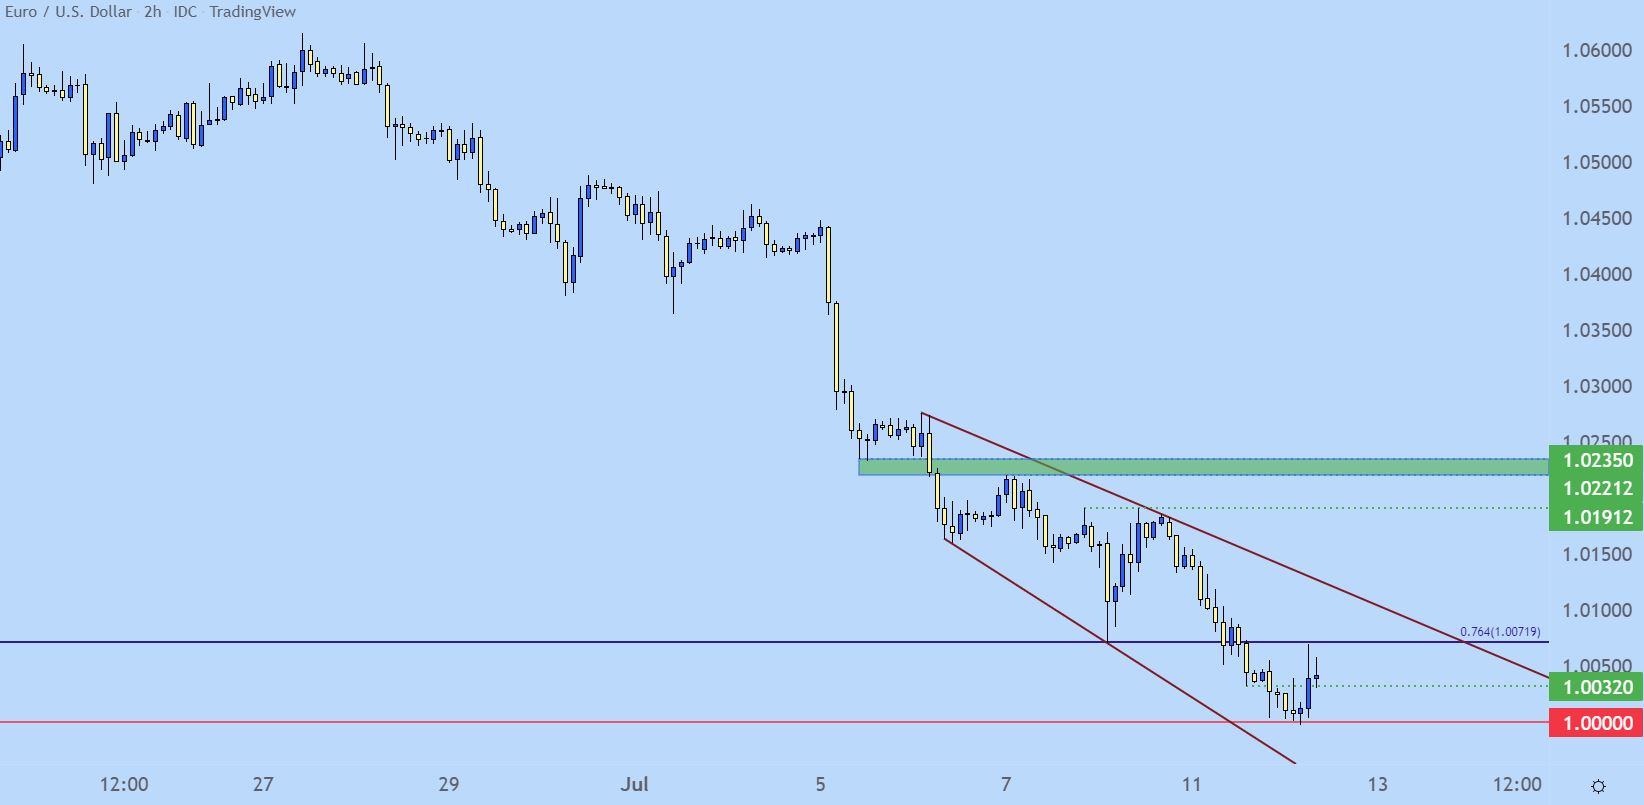
Chart prepared by James Stanley; EURUSD on Tradingview
EUR/JPY: Weak v/s Weak
While the Euro has been really weak of late, Japanese Yen weakess outpaced that of the Euro from March into the middle of last month. EUR/JPY failed to break through 144.25 on three separate occassions, building a bearish reversal formation in the process. There’s a double top with a neckline at 137.81 that’s already been breached, which keeps the door open for bearish themes in the pair. I had looked into this setup last week and Euro bears have continued to push since.
The next obstacle for bears is an area of support from 136.45-136.67. A breach of this area opens the door for a push down towards the 135.00 psychological level.
EUR/JPY Daily Price Chart
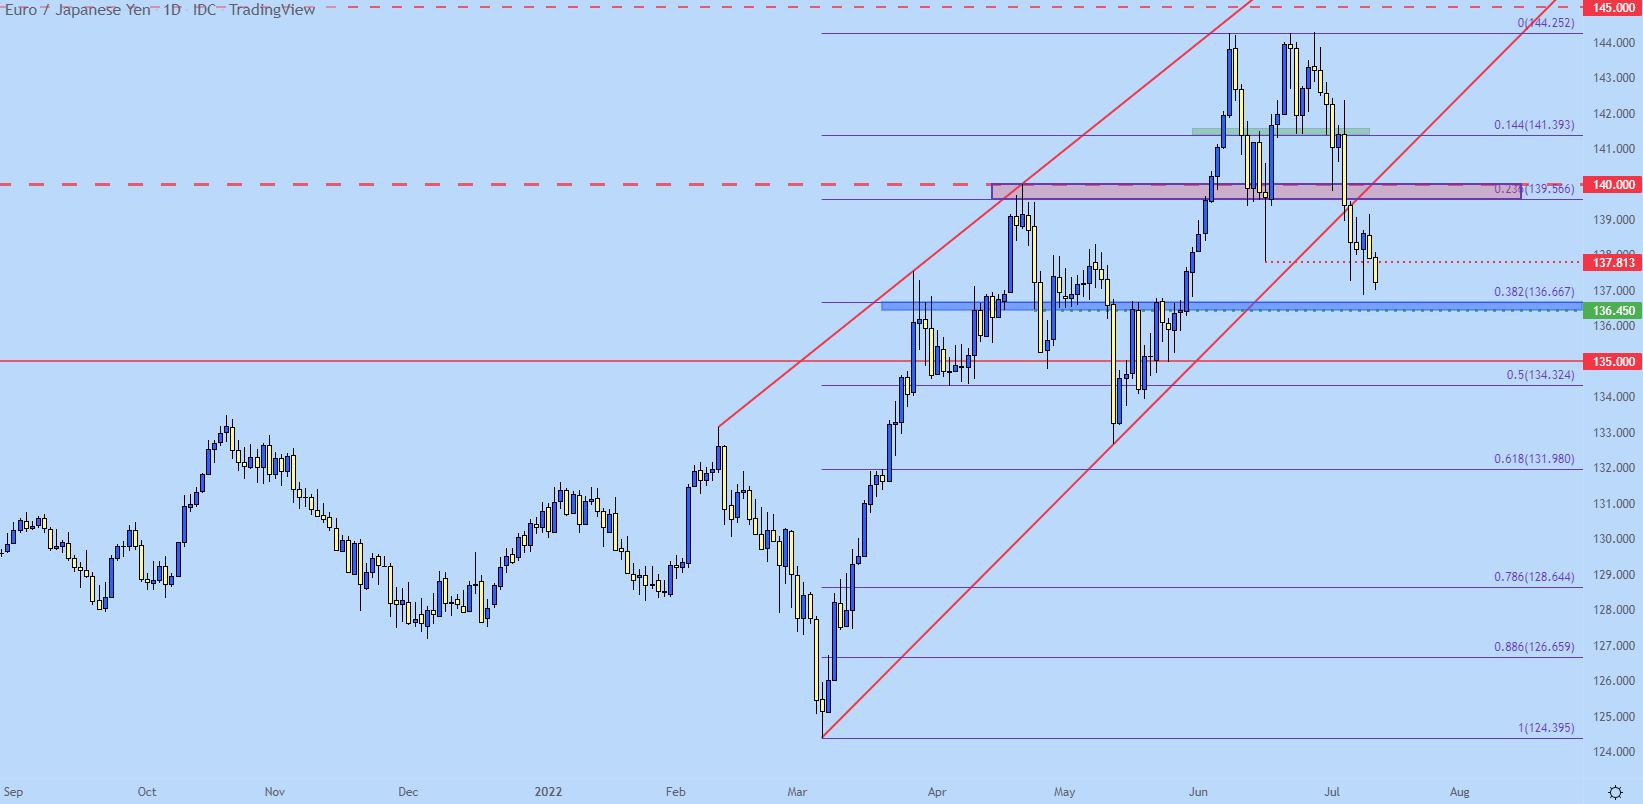
Chart prepared by James Stanley; EURJPY on Tradingview
EUR/CHF: Parity Drive
I had looked into this one last week but, the takeaway was the fact that EUR/CHF hasn’t really held below parity for very long. To be sure there were tests – such as 2015 when the Swiss National Bank abandoned the 1.2000 peg on EUR/CHF. After that happened, there were two weekly closes below that value before the pair snapped back and, eventually, tested that same 1.2000 ‘floor’ as resistance in 2018.
But – what makes this current iteration so interesting is how the Euro isn’t really recovering much at all yet. Last week’s close was sub-parity and so far this week, sellers are driving deeper-below that big figure. This is a major signal of just how bearish markets are on the Euro and, again, this roots back to central bank policy: The Swiss National Bank is hiking rates but the ECB is not, thereby allowing for a fundamental divergence to build in the pair. But, perhaps more disconcerting for the rest of the world – the more that the Euro sinks, the more inflationary pressure is on the horizon as imports are going to be more expensive on a relative basis.
In EUR/CHF, there was a swing from back in 2015 around the .9777 level and that remains a near-term support target for bearish continuation scenarios.
EUR/CHF Weekly Price Chart
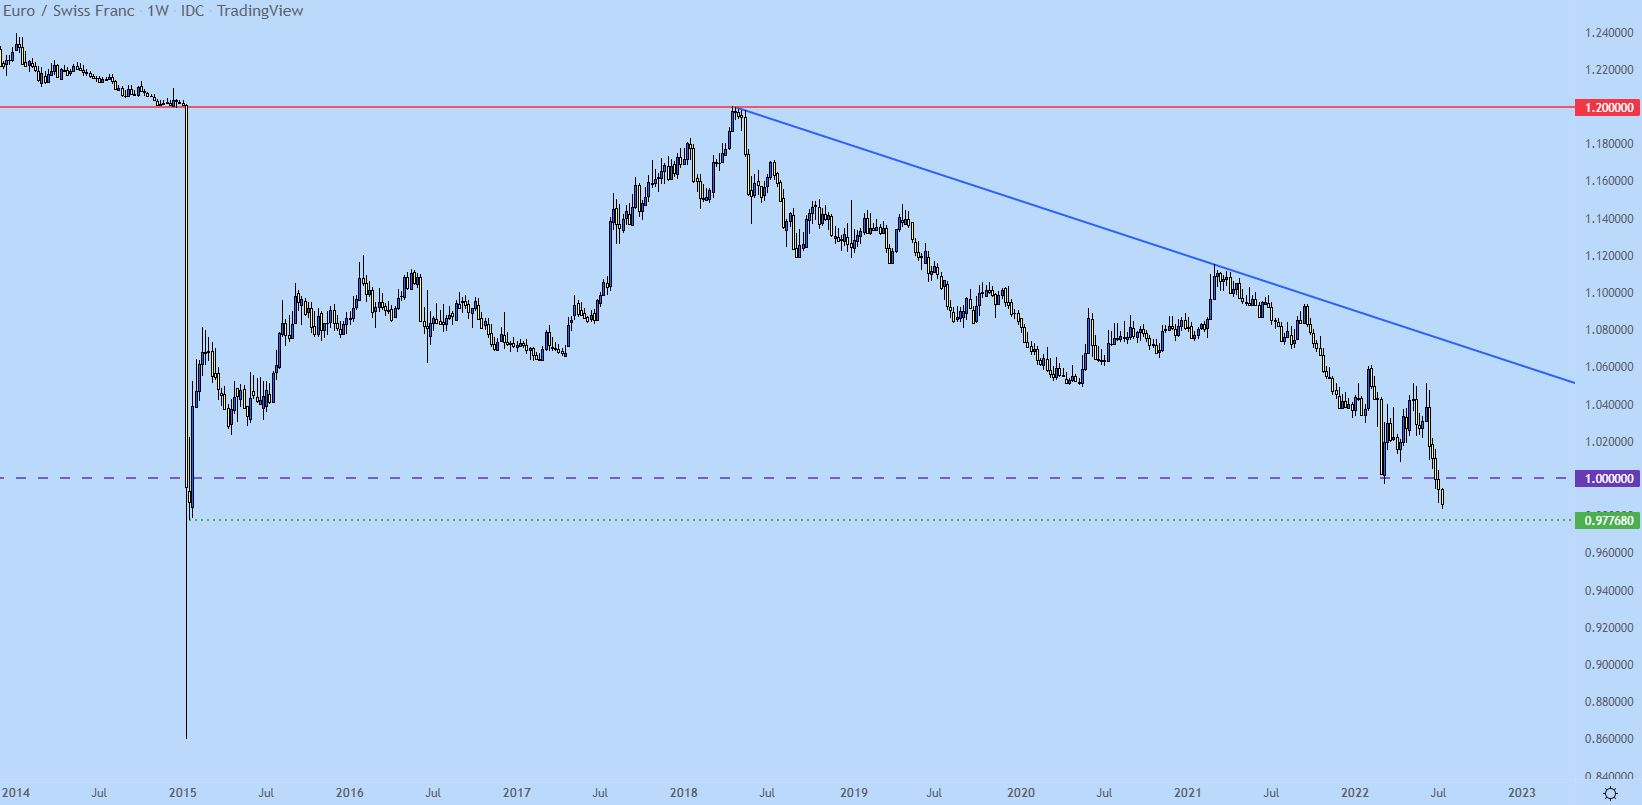
Chart prepared by James Stanley; EURCHF on Tradingview
--- Written by James Stanley, Senior Strategist for DailyFX.com
Contact and follow James on Twitter: @JStanleyFX


