


Japanese Yen Talking Points:
- The Yen continues to meltdown with fresh 20-year highs in USD/JPY to go along with fresh six-year highs in EUR/JPY, GBP/JPY and AUD/JPY.
- The move in the Yen has been ongoing for some time now and traders are carefully watching for verbal clues around the Bank of Japan for when they might finally step in to intervene but, as yet, there’s no such indication and accordingly traders have been selling the Yen aggressively in response.
- The current theme is reminiscent of the 2012-2015 run in the JPY as Abe-nomics was taking the economy by storm, and the current iteration began to brew back in September as the Fed opened the door for rate hikes, as looked at just after that September FOMC rate decision.
- The analysis contained in article relies on price action and chart formations. To learn more about price action or chart patterns, check out our DailyFX Education section.

Well, this probably isn’t going how the BoJ planned…
Governor Kuroda started the weak with some warnings on the Yen, saying that the currency has been depreciating rapidly and ‘that can cause trouble for companies when they make their business plans and we will need to take into account negative factors like these.’
The Finance Minister of Japan also chimed in, saying that the massive swings in the currency can be negative, after saying last week that the sudden drop in the currency is ‘very problematic.’
This runs counter to the BoJ pledge to keep stimulus online and this creates divergence in Yen-pairs, as higher rate regimes in the U.S., U.K. or, even Europe, create an uneven flow of capital between the currencies represented in the pair. And this isn’t a new thing, either: I had highlighted this all the way back in September of last year as the FOMC started to talk up rate hike potential. A few weeks later in October the Yen sell-off had already gotten started and as pressure has mounted on many western Central Banks to start addressing inflation – those divergences have only grown to where we are today, with USD/JPY surging to another fresh 20-year-high.
Such comments are being watched carefully to see when the Bank might actually step in, similar to what happened in 2015, as this is the clearest possible signal for when these Yen-pairs might finally top out and begin to retrace some of these recent gains. There’s little sign of that happening just yet.
USD/JPY
The major of USD/JPY is perhaps the most expressive as US rates continue to spike while Japanese rates extremely low with little sign of change. And there’s some amazing stats here: USD/JPY is now working on its 13th consecutive daily gain. And from the weekly chart, the pair is working on its sixth consecutive week of gains, drawing all the way back to early-March.
This is the carry trade in force and it feels amplified, to a degree, as we’ve seen a fast re-pricing of US rates so far this year. Below we can see a massive surge in March and so far in April that’s catapulted the pair to fresh 20-year-highs.
USD/JPY Monthly Chart
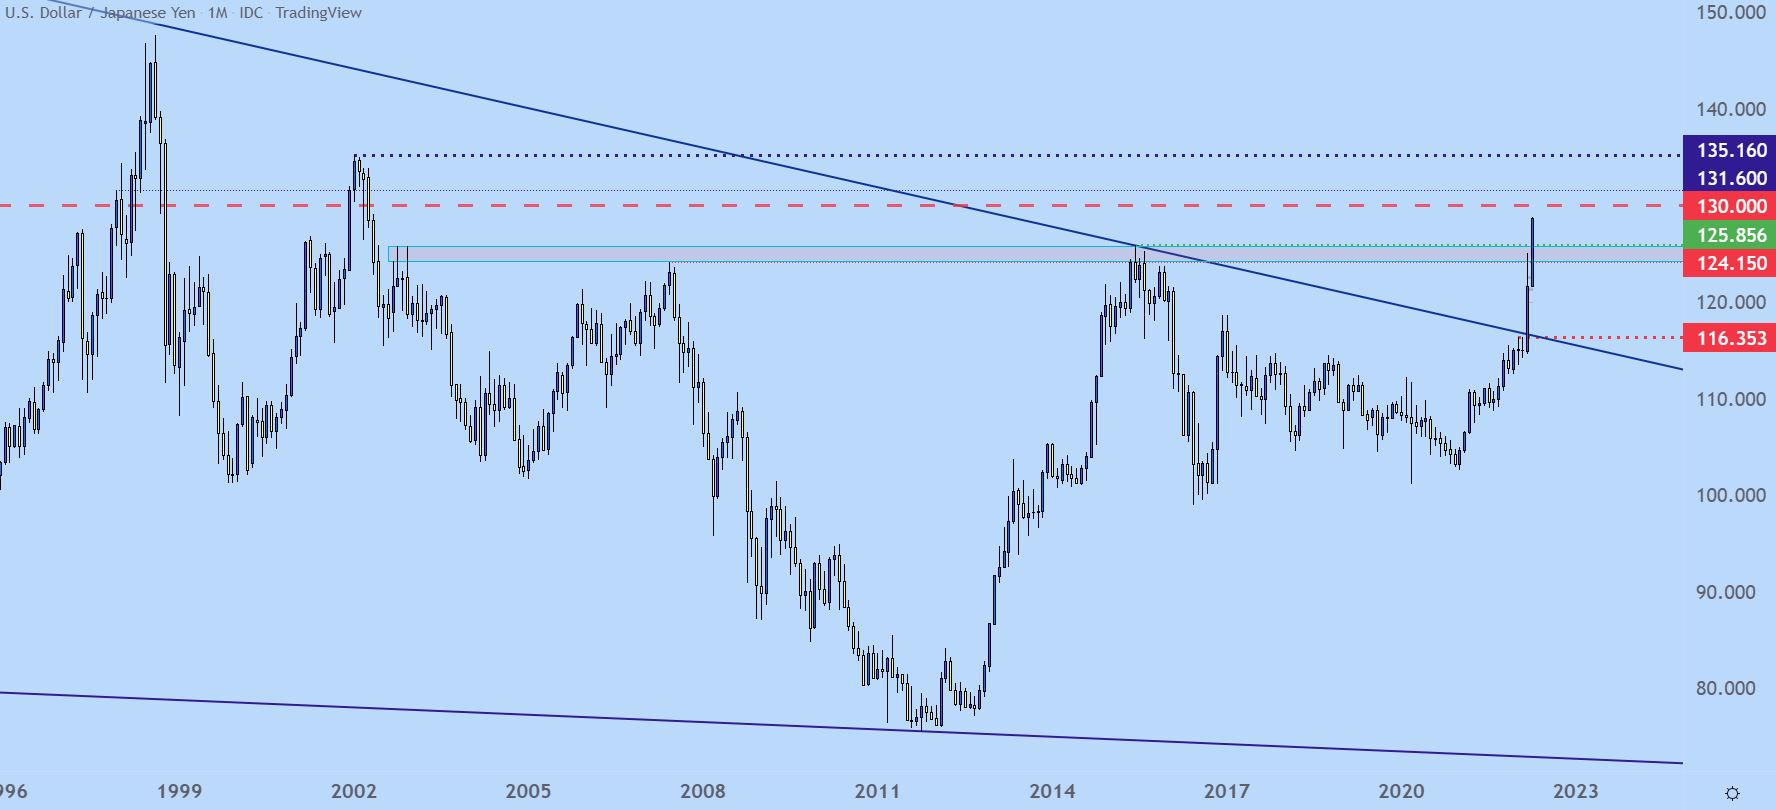
Chart prepared by James Stanley; USD/JPY on Tradingview
The big question, of course, is how to trade such a trend and it can be difficult because in essence the trader has to contend with an overbought market (that they’re expecting to get even more overbought). And there’s really just two common ways of doing so: Either hit the breakout or wait for the pullback. I had looked at the latter of these strategies in late-March, just as USD/JPY was pulling back to find support at the 121.41 level. USD/JPY has gained more than 700 pips since.
Looking at shorter-term charts, however, and there’s a lack of nearby support potential, especially considering the historical relevance of trading at fresh 20-year-highs. But, from the below chart we can see where the trend has recently heated up as price has jumped beyond a bullish trendline that was previously holding the lows. And there hasn’t really been much of a pullback since that test at 121.41 in late-March.
This indicates a short-term overbought scenario; but as we’ve seen here and, hopefully, as many traders have learned from this episode, overbought on its own isn’t a bearish thesis as breakaway trends can just run right through resistance as price gets even more overbought. This is the essence of the breakout condition, and to learn more about working with that, the link below will allow you to access a guide that discusses that strategy.

As for possible pullbacks – with a move that’s heated up as much as this has, it should be expected that corresponding pullbacks will also be rather large, similar to what was seen on the last episode when USD/JPY pulled back by more than 360 pips before finally finding support. That same 360 pips would’ve been seen as a massive move in the pair just a year ago but, in this episode it’s but a pullback.
As for nearby levels, there was a quick spot of resistance-turned-support at 126.55 that remains of interest. The prior 20-year high is down at 126.86 and that can be looked at as an ‘s2.’ But, for ‘s3,’ there’s a key spot on the chart, taken from the 125 psychological level that’s confluent with the 125.11 swing high from March.
USD/JPY Four-Hour Price Chart
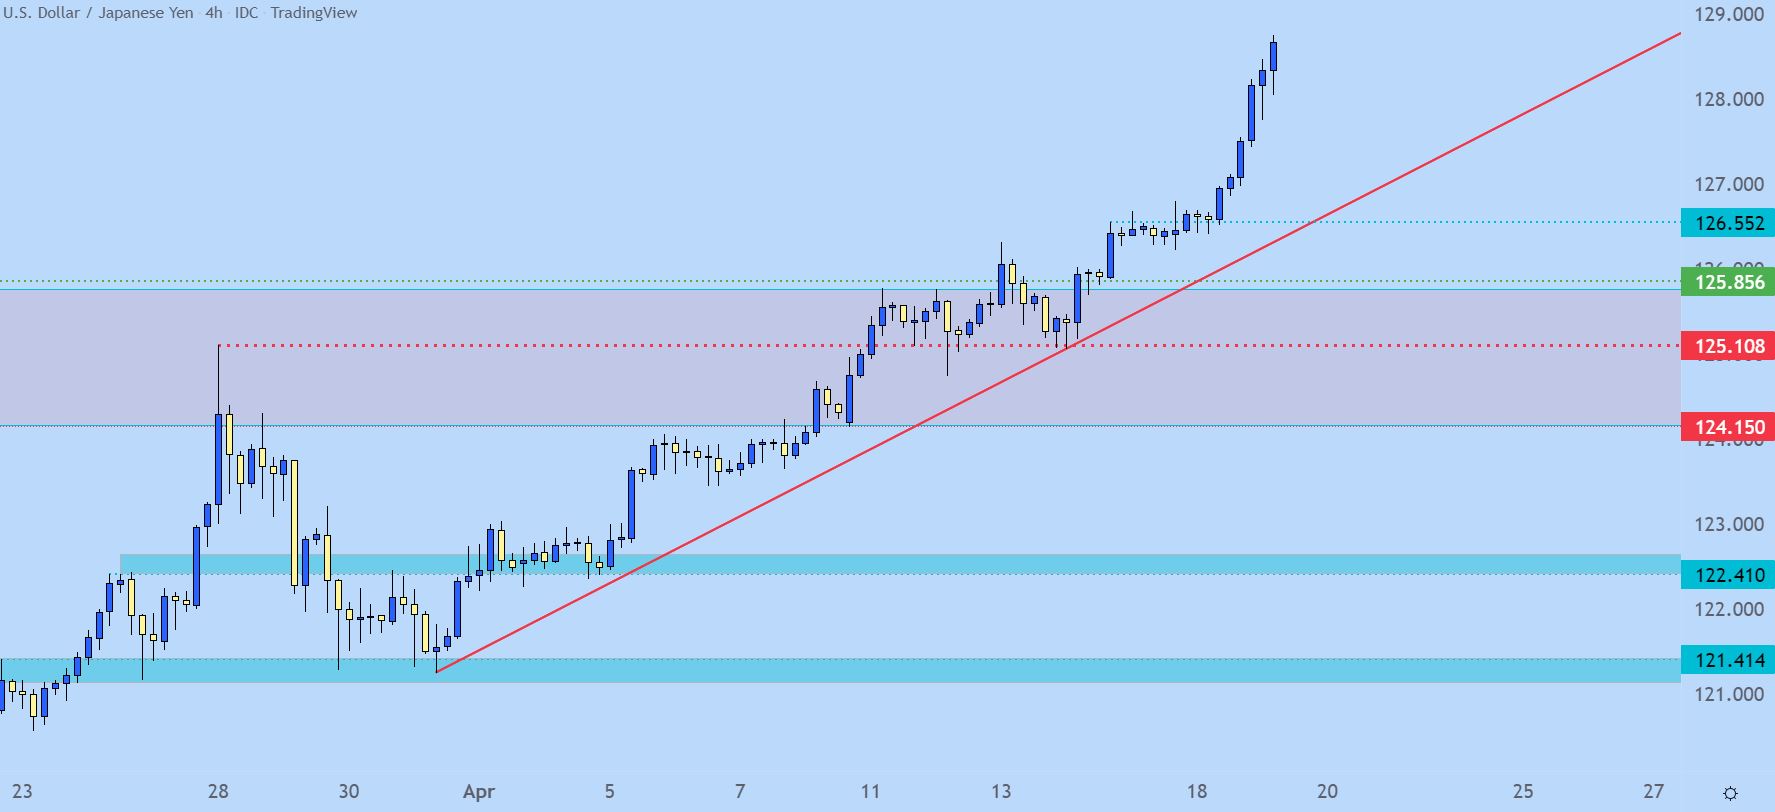
Chart prepared by James Stanley; USD/JPY on Tradingview
EUR/JPY Resistance
Ok, for those that really do want to get long the Yen with some expectation of pullback, they’d likely want to do that in a pair with another potentially weak currency.
And the Euro has been weak, even moreso after last week’s ECB meeting highlighted a Central Bank that doesn’t seem to be open to higher rates, perhaps even more than the BoJ. This is reflected in the massive trend in the EUR/JPY chart as markets are clearly illustrating the expectation for greater passive monetary policy out of the BoJ than the ECB.
The pair posed a stunning turn-around in March for probably what is one of the largest bullish engulfing candlesticks that I’ve ever seen. An early-month drop of 450 pips was soundly reversed and the month ended with a 500 pip gain. The total range for March was a whopping 1,300 pips, and that theme has continued so far through April trade.
The 139.00 level is of interest for resistance: This is the 38.2% Fibonacci retracement of the 2001-2008 major move. It’s also an area that held a lower-high back in the summer of 2015, and this was a level that the pair couldn’t test in 2018 as that run topped out at 137.50.
EUR/JPY Monthly Price Chart
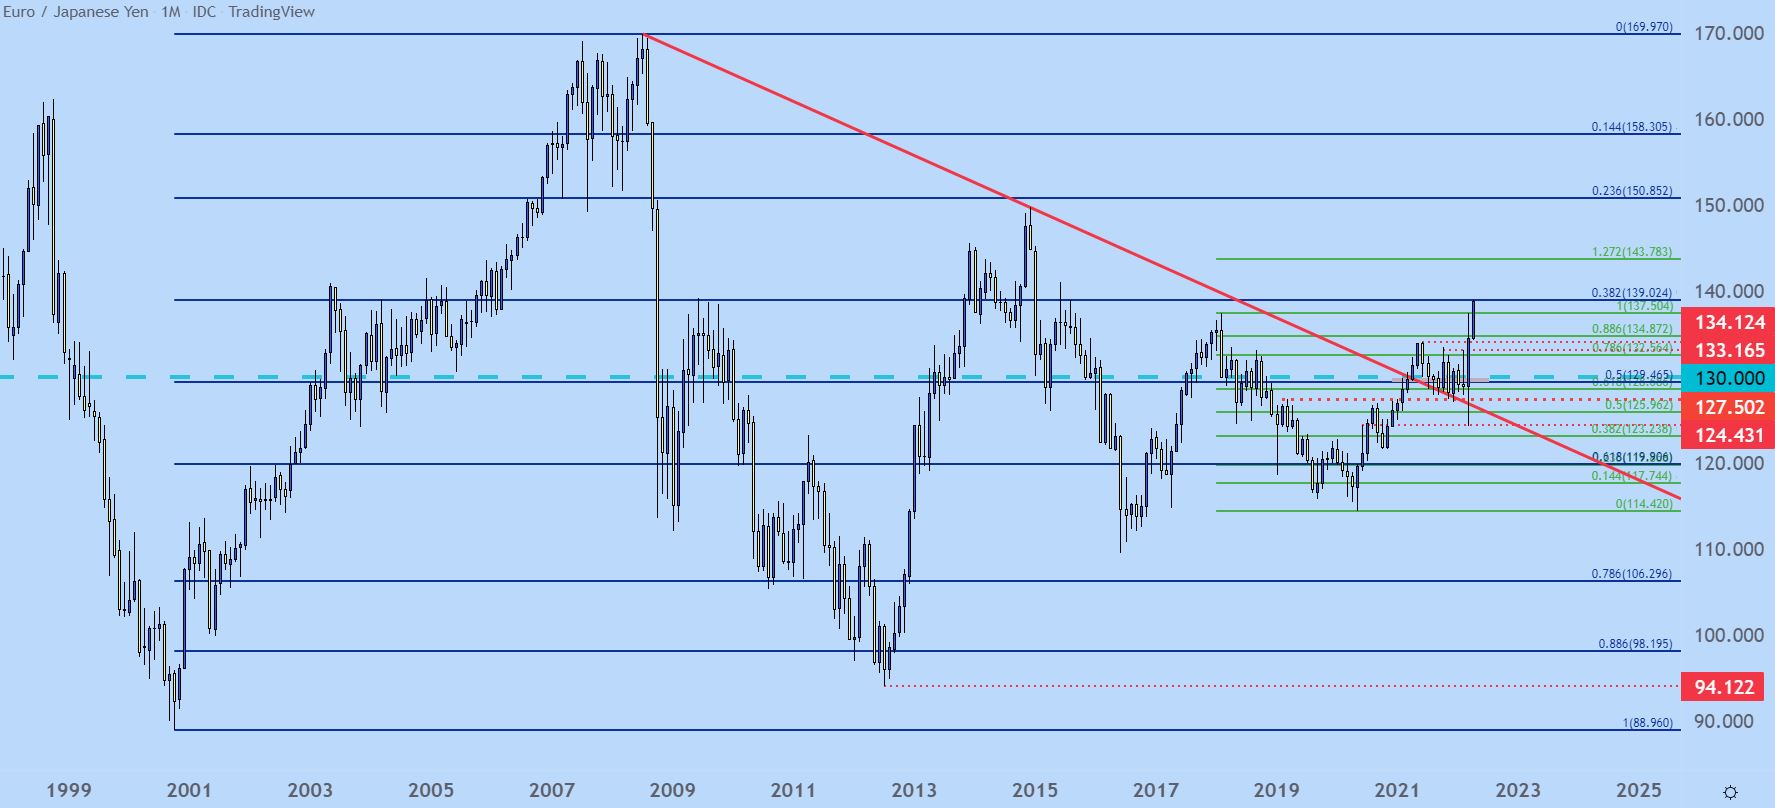
Chart prepared by James Stanley; EUR/JPY on Tradingview
EUR/JPY Shorter-Term
That 137.50 level remains of interest as this 2018 swing high had also helped to hold the 2022 high for about three weeks, until this morning’s breakout. This could be an attractive area to look for longer-term support in the pair; and if resistance doesn’t hold at 139, there’s another possible spot at the major psychological level of 140 just above that.
EUR/JPY Daily Price Chart
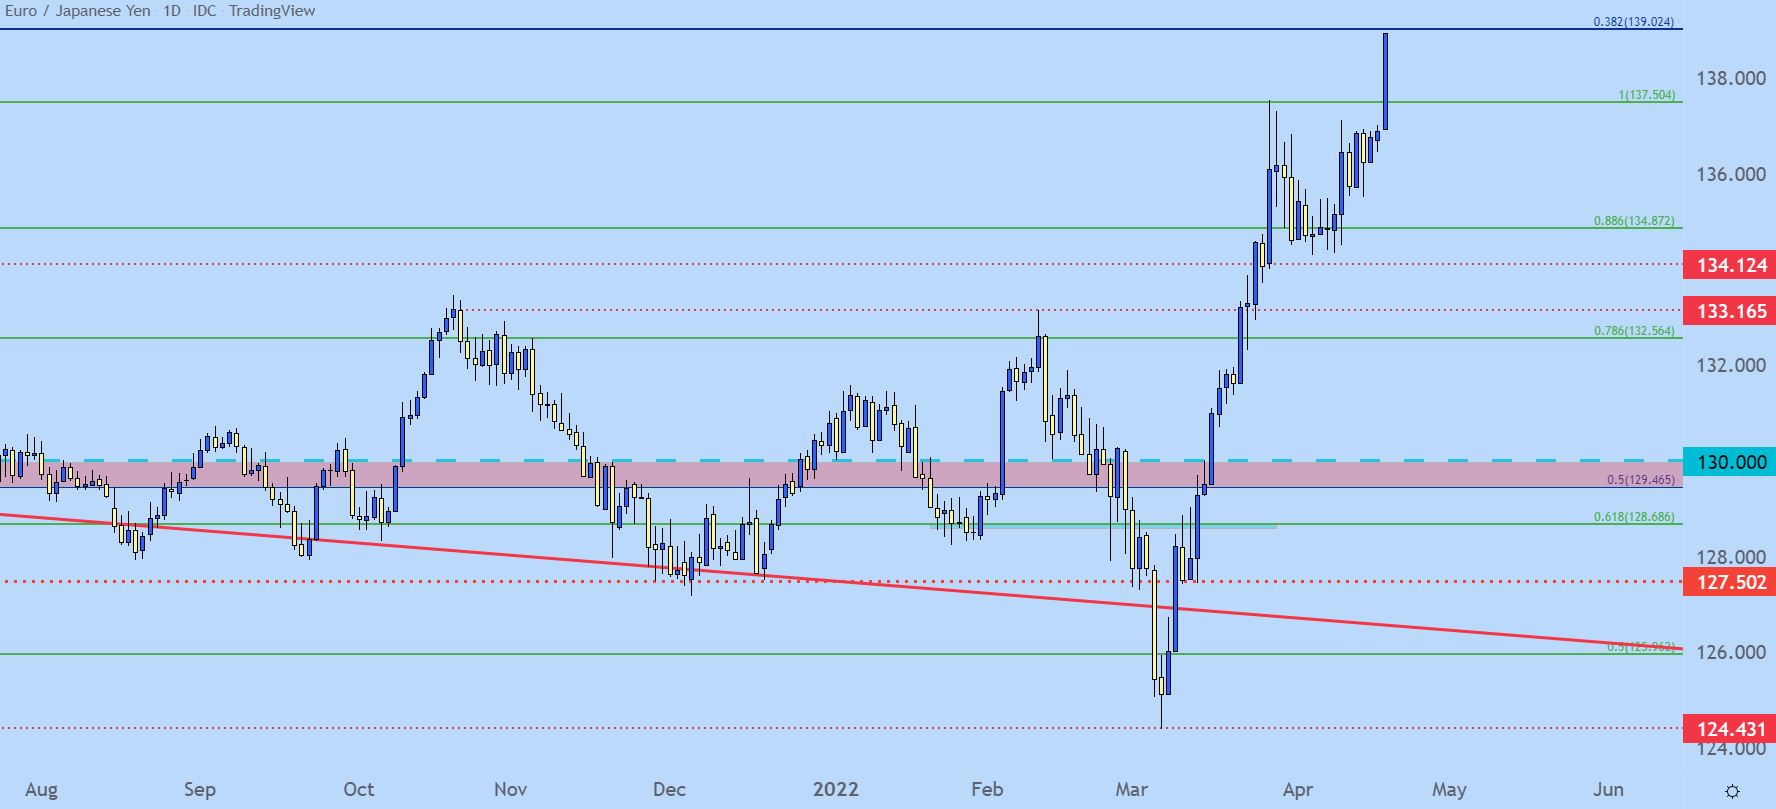
Chart prepared by James Stanley; EUR/JPY on Tradingview
GBP/JPY
When I touched into the matter earlier this month, looking for extensions in these Yen trends, GBP/JPY was a focus chart for me as the pair had built in a very clean ascending triangle formation. Such setups are often approached with the aim of bullish breakouts and a couple weeks later, that breakout is still running.
Similar to USD/JPY, however, there’s no clear indication that this run is nearing its endpoint yet. So, the trader has the unenviable job of either chasing the breakout higher while the market is already overbought; or trying to be patient and waiting for a pullback. Personally I’d rather go the patience route rather than force a loss on a suboptimal setup.
The level of 168.00 remains of interest, this is the 61.8% retracement of a major move from which the 38.2 retracement set recent support (in red, below). The 50% marker from that major move is near the 160.00 level, which can create an interesting area of support potential if/when a pullback does show up. Shorter-term, a more nearby level at 165.69 could be looked to for short-term support potential.
GBP/JPY Weekly Price Chart
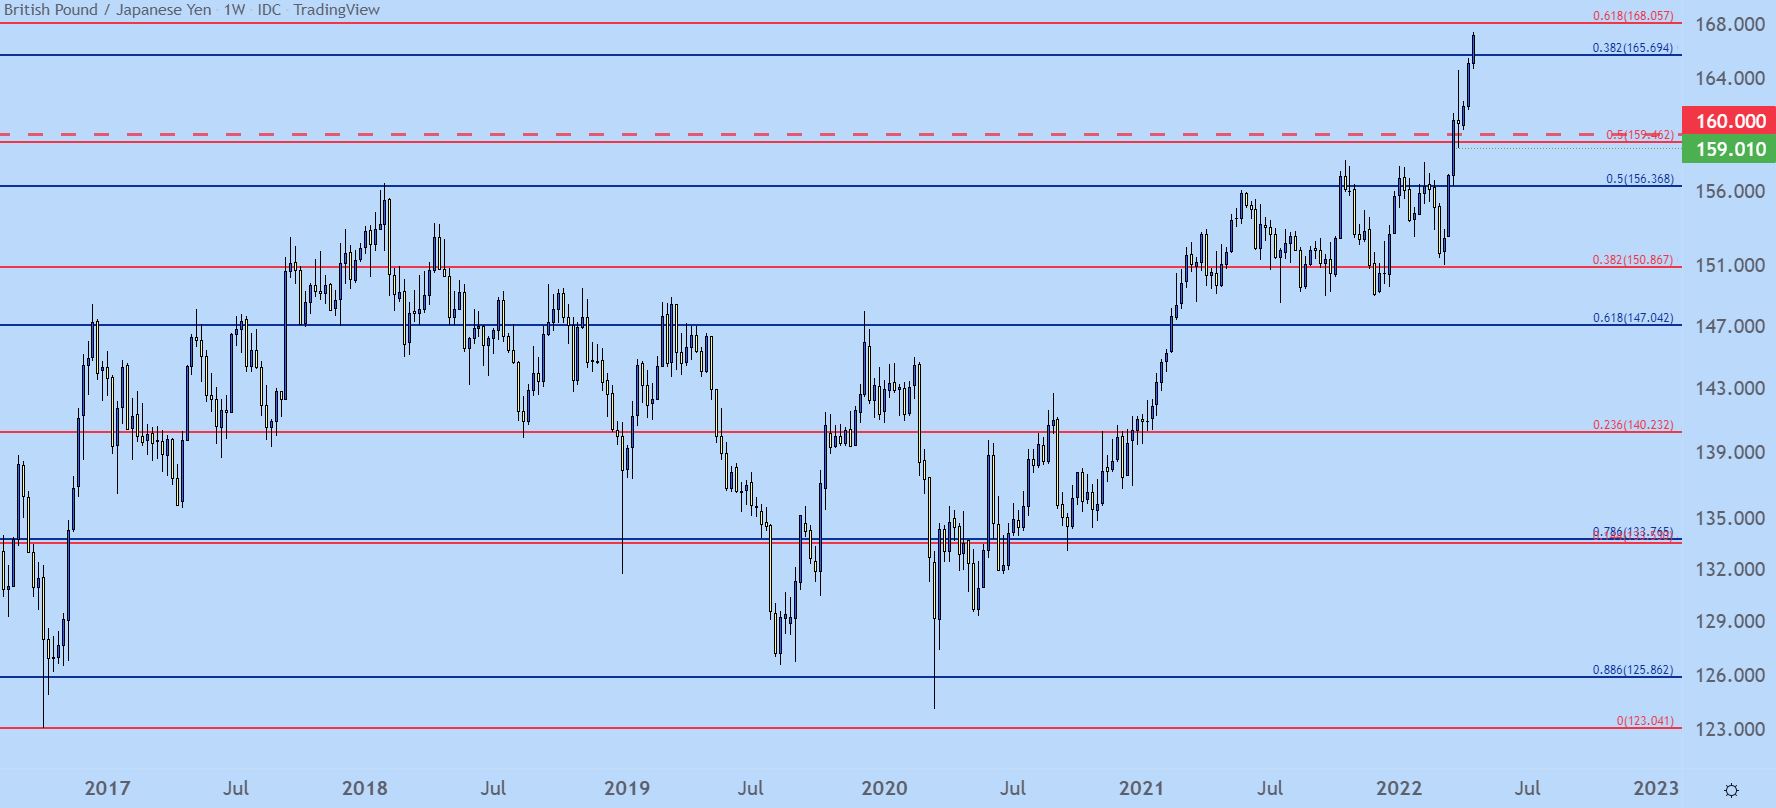
Chart prepared by James Stanley; GBP/JPY on Tradingview
AUD/JPY
Going back to last year and I was even trying to work with this Yen-theme back then. At the time, US rates had just started to lift in anticipation of the Fed making a hawkish turn as inflation raged in the background.
That led to a steady jump for yields in Q1 of 2021 but when it became clear that the FOMC wasn’t yet nearing any rate hikes, those themes slacked during Q2 and Q3 only to come back to life in Q4.
But – during that Q1 episode there was one pair that looked especially attractive to me then and that allure remains more than a year later in AUD/JPY. At the time, the pair had built in an inverse head and shoulders pattern with resistance around the 80 psychological level, a price that the pair had trouble with previously and when that gave way, the 85 handle came in as that next spot of resistance and that more or less helped to hold the highs through the rest of last year.
Buyer started to get back in the driver’s seat by Q4 and in December the pair had already re-engaged above the 80 level.
And, in March, the pair began to test the 85 level again, this time breaking out and leaving it behind as bulls backed commodity currencies over the impressively weak Japanese Yen.
Now the pair is nearing the next major psychological level at the 95.00 area, marking a fresh six-year-high as bulls have remained large and in-charge. For traders that are aggressively tracking this Yen-weakness, 95 presents breakout potential. For those looking to wait while being patient, both 92.50 and 90.00 are nearby spots of possible support, after which the 87.50-87.70 area comes into play as an ‘s3’ spot of support potential.
AUD/JPY Weekly Price Chart
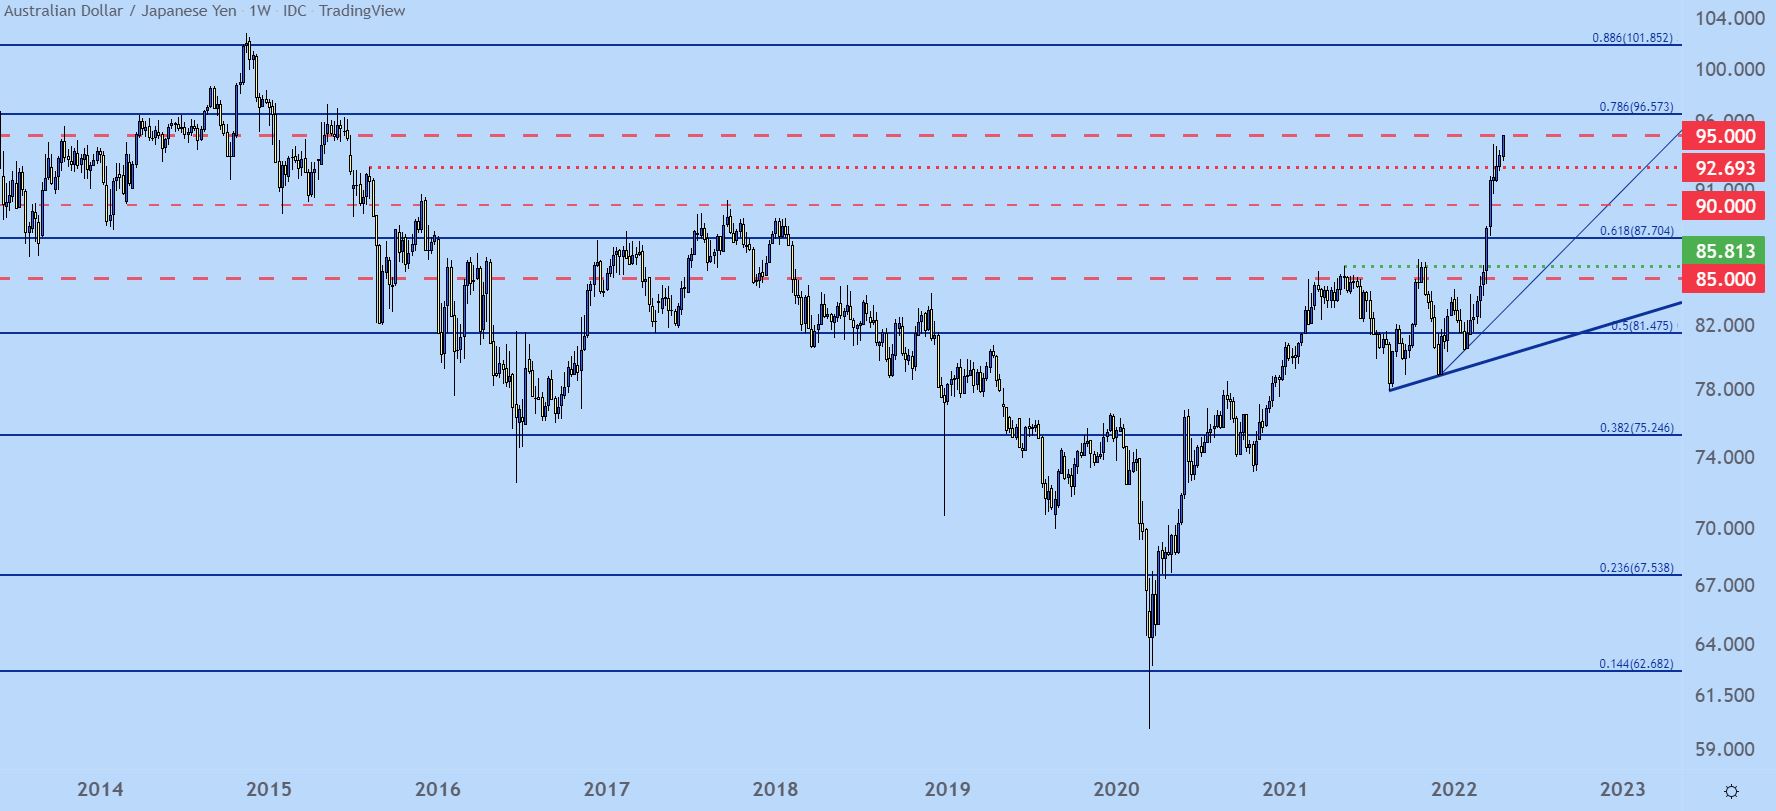
Chart prepared by James Stanley; AUD/JPY on Tradingview
--- Written by James Stanley, Senior Strategist for DailyFX.com
Contact and follow James on Twitter: @JStanleyFX


