


Dow, S&P 500, Nasdaq Talking Points:
- The S&P 500 and Nasdaq 100 remain with bearish potential. The Dow has been mean reverting but on a shorter-term basis, there’s a more justifiable bearish case there, as well.
- Major sell-offs rarely happen in a straight line, and failure from bulls to recover more of the January sell-off has left support as vulnerable.
- There’s been a clear sentiment shift since the extreme-hawkish narrative has taken-over around the FOMC, particularly with both the President and the Treasury Secretary urging for tighter policy to reign in inflation.
- The analysis contained in article relies on price action and chart formations. To learn more about price action or chart patterns, check out our DailyFX Education section.
Trade Smarter - Sign up for the DailyFX Newsletter
Receive timely and compelling market commentary from the DailyFX team
U.S. equities continue to display a high degree of resilience as even as traders juggle to the dual threat of war and tighter monetary policy from the FOMC. Yesterday’s release of FOMC meeting minutes provided a bit of relief as it showed a bank not as worried as what many have come to expect, with rates markets now pricing in as many as 7-8 rate hikes out of the Fed this year. All of the Nasdaq, S&P 500 and Dow Jones have held a series of higher-lows after bottoming-out (near-term) on Monday of this week.
Looking ahead, we have some drivers on the economic calendar with James Bullard giving some comments at 11 AM ET. Bullard had upset markets last week with some extremely hawkish comments, saying that the Fed was behind the curve and that he’d support 100 basis points of rate hikes before July. This was far out of band from current expectations, and Bullard later clarified that he felt the Fed’s credibility was on the line, given their continued dismissal of inflation last year as ‘transitory.’ Loretta Mester speaks at 5 PM ET and in her remarks last week, she also indicated a more aggressive path for the Fed, albeit not as extreme as Bullard’s comments.
And there’s more Fed-speak on the calendar for tomorrow, with Evans at 10:15 AM ET and Waller thirty minutes later.
Equities Stance
I remain bearish on US equities, big picture. The overriding driver is the clear sentiment shift that’s shown since the Fed has posed a more-firm hawkish tilt, with a clear change in price action showing in January. I think stocks could perform well with a regime of slow and methodical rate hikes, similar to the Fed’s stance in 2015 and 2016 and I think this was the general expectation after the December FOMC rate decision: But the idea of all-of-the-sudden turning off the light switch poses a much stronger shift and this is something that could cause further re-pricing in American and, in-turn, global equities.
The fact that the U.S President and Treasury Secretary are both urging the FOMC to shift tightening into a higher gear is just another bizarre turn of events that could further force risk-off themes across markets.
But, as is usual, timing is of importance, and rarely do new phases or trends show in a linear manner, it’s often a series of lower-lows and lower-highs starting to open the door to a larger bearish movement.
S&P 500
In the S&P 500 the Fibonacci retracement produced by the January pullback continues to guide near-term price action. The 61.8% retracement of that major move caught two iterations of resistance earlier in February. But the corresponding reaction saw buyers show up at the 23.6% retracement and for this week, the 38.2% marker has been in-play multiple times as support.
The next support down on my chart is at 4420, taken from the Monday session high. This hasn’t been tested as support yet, so I’d expect at least a moderate bounce from it’s first appearance as support.
This corresponding bounce from that support, however, may be setting a bull trap, so I wouldn’t want to get too comfortable on the long side, instead I’d look for a lower-high to print in the event of a deeper sell-off.
Below 4420, 4400 and 4381 are both key. The big level of support at this point is from the 23.6% retracement of that Fibonacci setup, which also marks the February low. Breaches below this level open the door for a stronger breakout, pushing towards 4298 or perhaps even as deep as the 4213 low that printed in late-January.
On the resistance side of the coin, I’d remain bearish short-term for today until the 4500 level is taken out, at which point the door is open for a run up to 4528. It’s a bit messy beyond that but there’s a clear line in the sand at 4580, with another looming spot of resistance just above at 4590-4600.
S&P 500 Two-Hour Price Chart
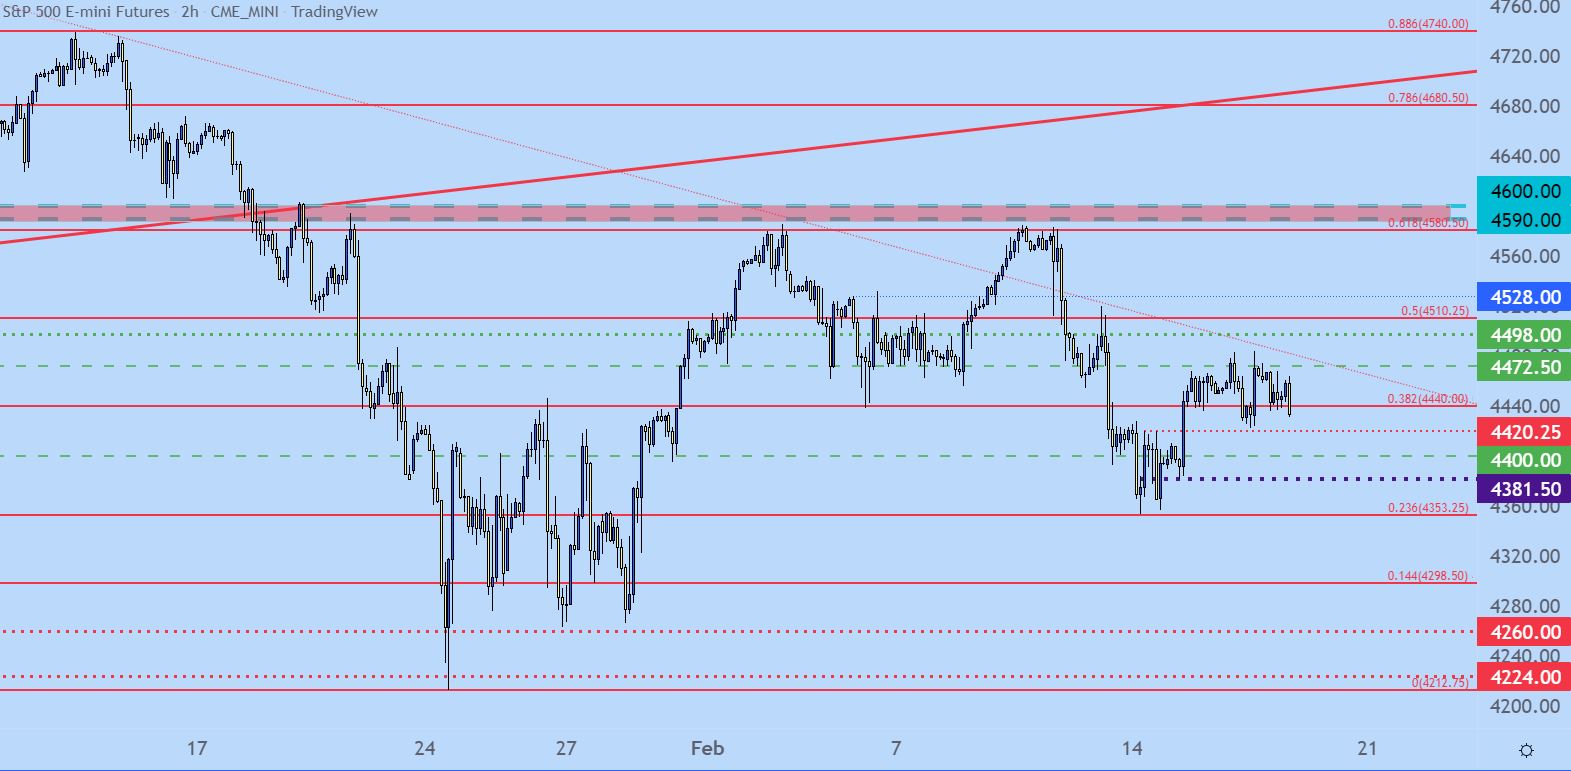
Chart prepared by James Stanley; S&P 500 on Tradingview
Nasdaq 100
If bearish equity themes are going to take over I remain of the mind that the Nasdaq could be a more amenable area for weakness in stocks, particularly if that driver is of the rates variety.
Similar to the S&P 500, it appears that there’s been a recent behavioral change since the extreme-hawkish scenario has taken over this year. And after setting a fresh six-month-low almost a month ago, prices have continued to drive deeper into a symmetrical wedge pattern. This could even take on the look of a bear pennant as a symmetrical wedge has built after a strong bearish move.
The below eight-hour chart illustrates this well.
Nasdaq 100 8-Hour Price Chart
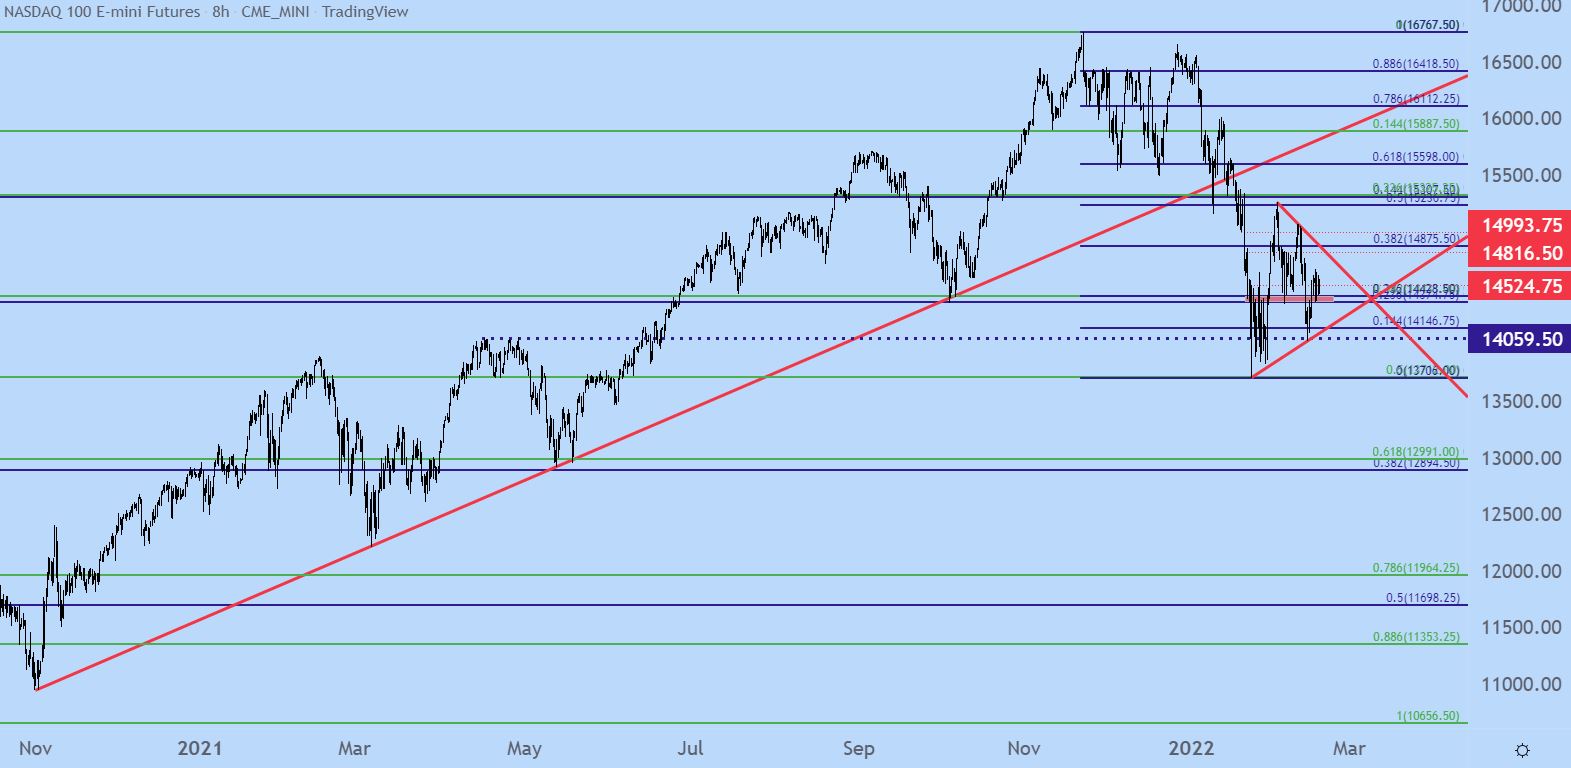
Chart prepared by James Stanley; Nasdaq 100 on Tradingview
Nasdaq Shorter-Term
Similar to the above in the S&P, recent price action has been mean-reverting as that symmetrical wedge has built. In the middle of that wedge is a big area of support that’s been in-play for a month now, and this plots from 14,375-14,430. This zone caught another spot of support yesterday, but notably the ensuing bounce remained below the prior swing-high, indicating bearish potential.
Next supports on my chart plot at 14223 and then at 14059. A break of that level also breaks the bottom side of the wedge, and can open the door to a deeper sell-off.
Nasdaq 100 Two-Hour Price Chart
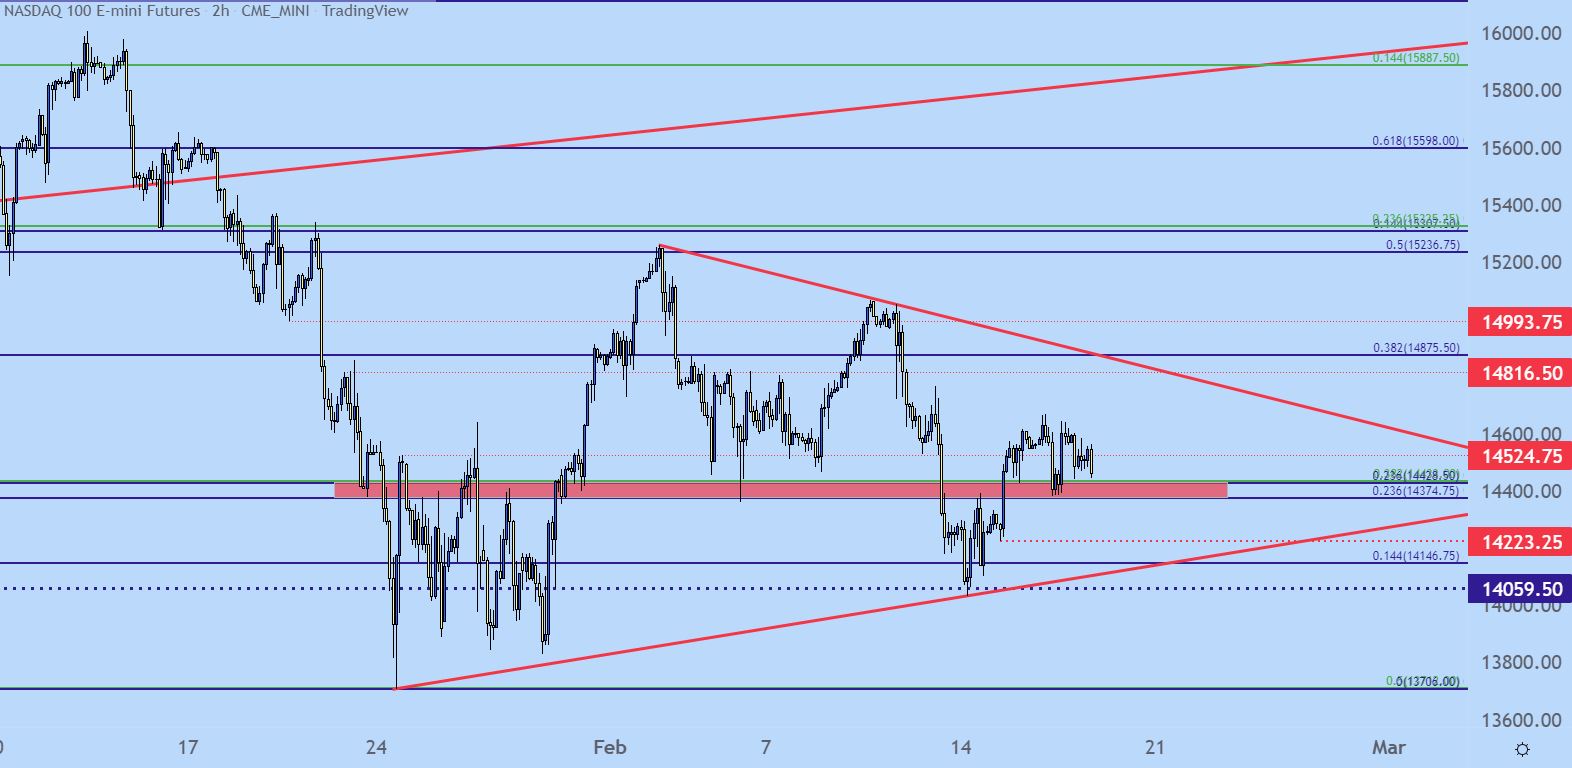
Chart prepared by James Stanley; Nasdaq 100 on Tradingview
Dow: Relative Stability
The longer-term chart of the Dow does highlight a greater degree of stability at the moment. While there was a filtering in of pain in late-January, this was a mere support test to the Dow at which point prices pushed back into the prior range.
That support probe, however, may be highlighting some bearish potential. But, likely, those themes will remain as more attractive in the above two indices of the S&P 500 and the Nasdaq 100 for now.
Mean reversion has been the name of the game in the Dow for almost eight months now. The below weekly chart highlights this range well.
Dow Jones Weekly Price Chart
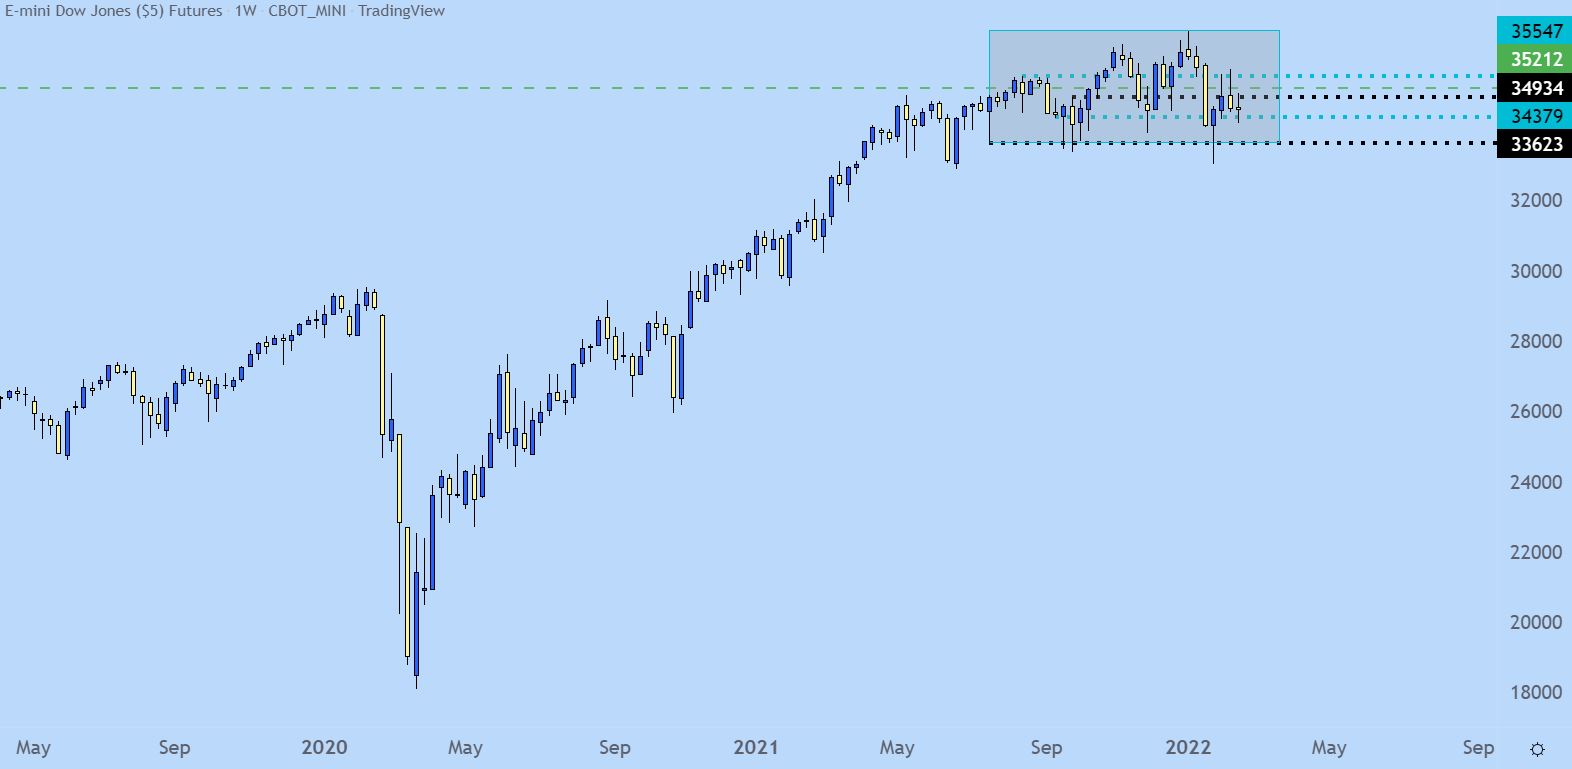
Chart prepared by James Stanley; Dow Jones on Tradingview
Shorter-term, there’s some trending potential, but again, this isn’t as clear as it is in either of the above two indices. For support, I’m tracking 34379, and then 34,205. A break below that second level gives similar bearish tendencies. On the upside, a hold above 34,483 keeps the door open for another test of the 34,934 level, which is the 50% marker of that January sell-off.
Dow Jones Four-Hour Price Chart
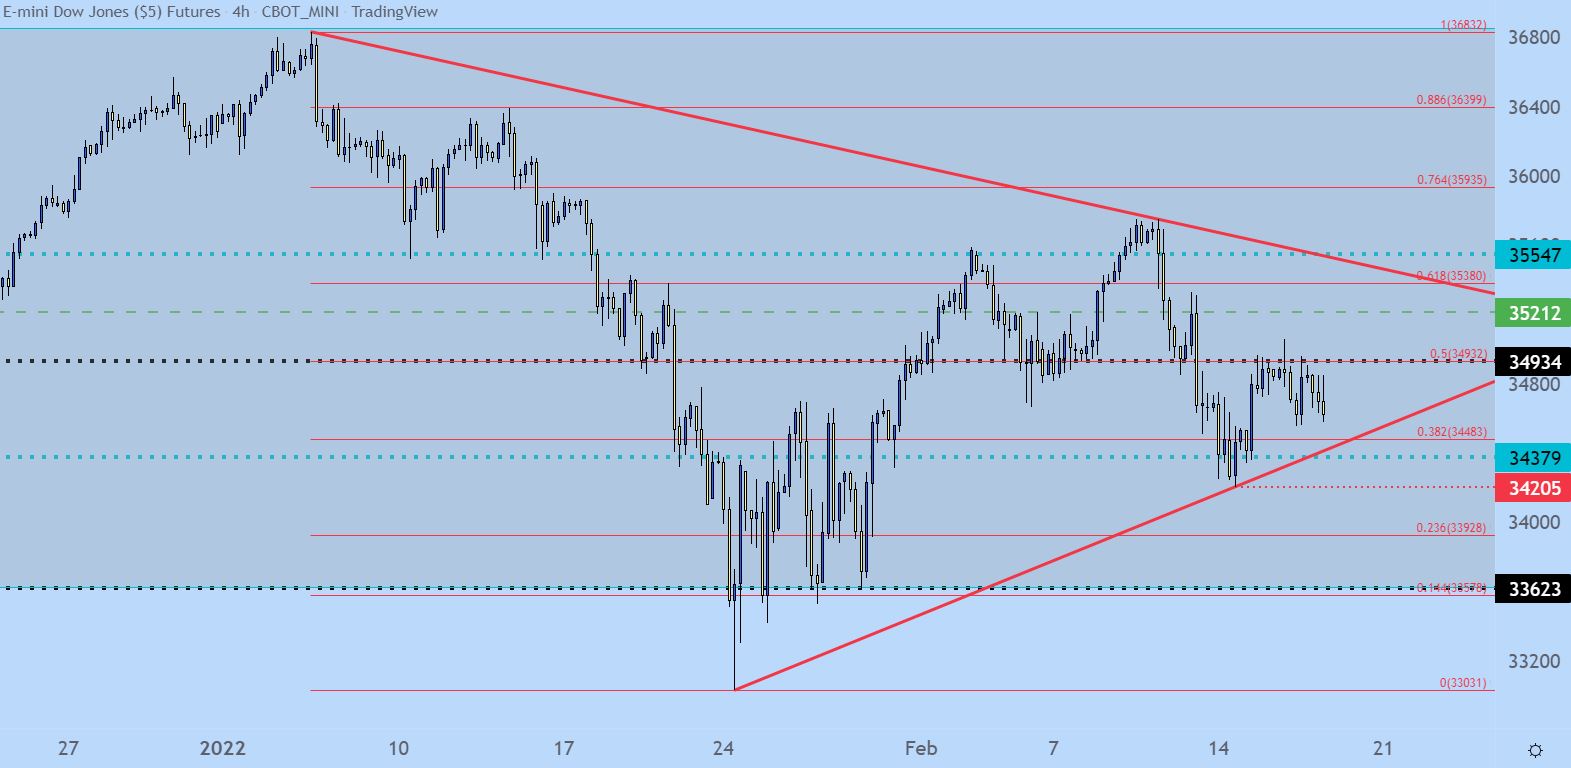
Chart prepared by James Stanley; Dow Jones on Tradingview
--- Written by James Stanley, Senior Strategist for DailyFX.com
Contact and follow James on Twitter: @JStanleyFX


