


US Dollar, USD, EUR/USD, GBP/USD, AUD/USD, USD/JPY Talking Points:
- The US Dollar is pulling back after last week’s breakout from the ascending triangle formation.
- The big USD driver for this week is NFP on Friday, and this report may get extra attention given what Jerome Powell said at the September FOMC rate decision, with the bank ready to make a taper announcement provided that employment data didn’t disappoint.
- The analysis contained in article relies on price action and chart formations. To learn more about price action or chart patterns, check out our DailyFX Education section.

The US Dollar is bouncing from higher-low support today in a move that, thus far, has been extremely clean for such a forceful breakout.
Last week I highlighted the ascending triangle that had built in the USD, and with the drive remaining from the FOMC rate decision the week before, bullish breakout biases seemed optimal given the match of technical and fundamental backdrops. The ascending triangle itself is often followed with the aim of bullish breakouts, hypothesizing that the momentum that’s continued to bring in bulls at higher-lows can, eventually, lead to a break of horizontal resistance.
To learn more about the ascending triangle formation, check out DailyFX Education
In the USD, that breakout went down last Wednesday, just ahead of the Q4 open, and prices ran all the way up to a Fibonacci level at 94.47, which is the 38.2% retracement of last year’s sell-off.
To learn about Fibonacci, check out DailyFX Education
That resistance inflection led to a pullback with the USD reverting back to prior resistance to set support. That prior resistance played-in from a set of previous 2021 swing-highs, with the topside of the zone at 93.73 coming from the August swing-high.
The challenge at this point appears to be timing: The next major driver on the calendar for USD is the NFP report set to release on Friday morning. And given what the Fed said at the September rate decision, how employment data was the item keeping the FOMC from formally announcing a taper and provided that there wasn’t a major disappointment, the bank would be ready to make a formal announcement soon. This was widely inferred to mean November, in which case there would be but one NFP report between that statement and the Fed’s next rate decision.
So this NFP could elicit a big response given how loaded the situation is regarding taper. And this will likely be the next big compelling item on the USD, unless something unexpected happens.
So the question is whether bulls are so aggressive that they bid the move in anticipation of NFP, or whether we’ll see USD price action continue to digest some of last week’s breakout move as traders square up positions ahead of that release on Friday morning.
For that, the support zone taken from prior resistance runs down to the Q1 swing high of 93.44, which can provide for some additional room for pullback ahead of Friday.
US Dollar Daily Price Chart
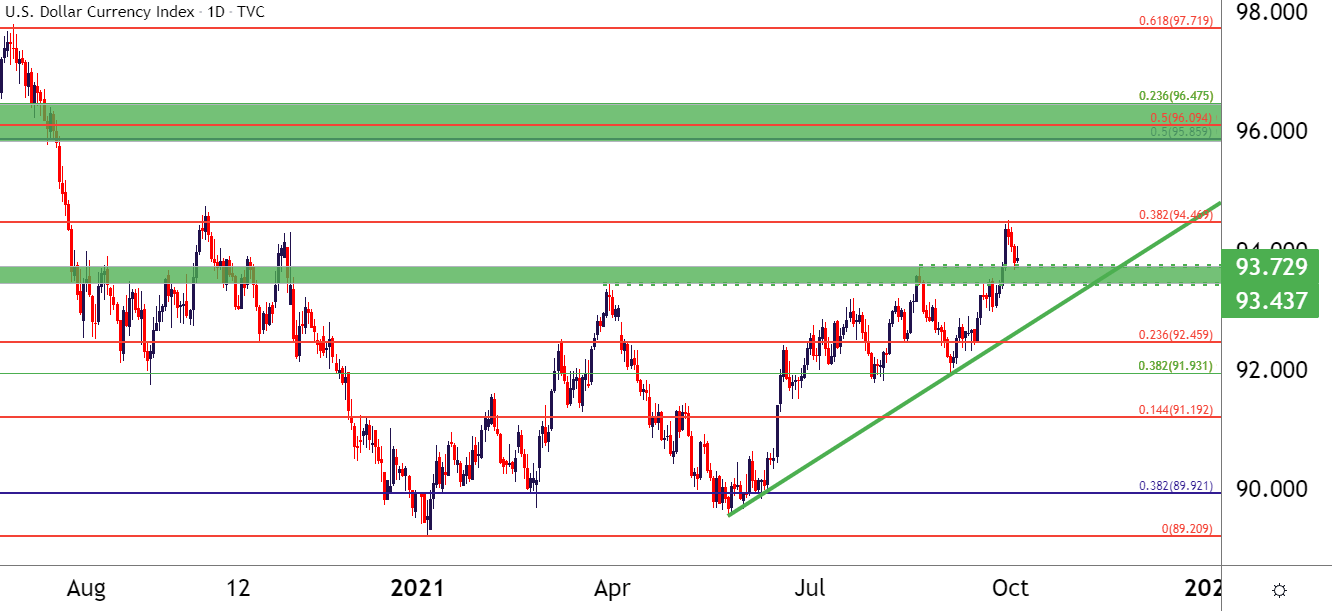
Chart prepared by James Stanley; USD, DXY on Tradingview
EUR/USD Postures at Fresh Lows
Part of the reason that the breakout in DXY was so forceful was because it had some stellar participation from EUR/USD, which dropped like a rock during last week’s breakout and cleared through the 1.1600 point of support. I had looked at breakdown potential in the pair ahead of the move in last week’s Analyst Pick.
The only problem here is similar to what the pair experienced in August, in which it tested below a huge zone of support only to stall shortly thereafter, leading to an aggressive pullback. We’ve seen a similar instance of stalling at fresh lows in this current run in EUR/USD, the pair breached the 1.1600 level but couldn’t make much ground below 1.1564, after which prices have started to pullback.
There’s a couple of areas to follow for lower-high resistance and similar to the mirror image of USD above, this could be of interest in anticipation for NFP, looking for a hold at either ‘r1’ or ‘r2’ in order to allow for bearish trend scenarios. In this scenario,
If NFP comes out really weak and NFP goes into breakdown, look for EUR/USD to work up towards the 1.1850 area; and a breach above 1.1900 could serve as invalidation of the bearish trend.
EUR/USD Daily Price Chart
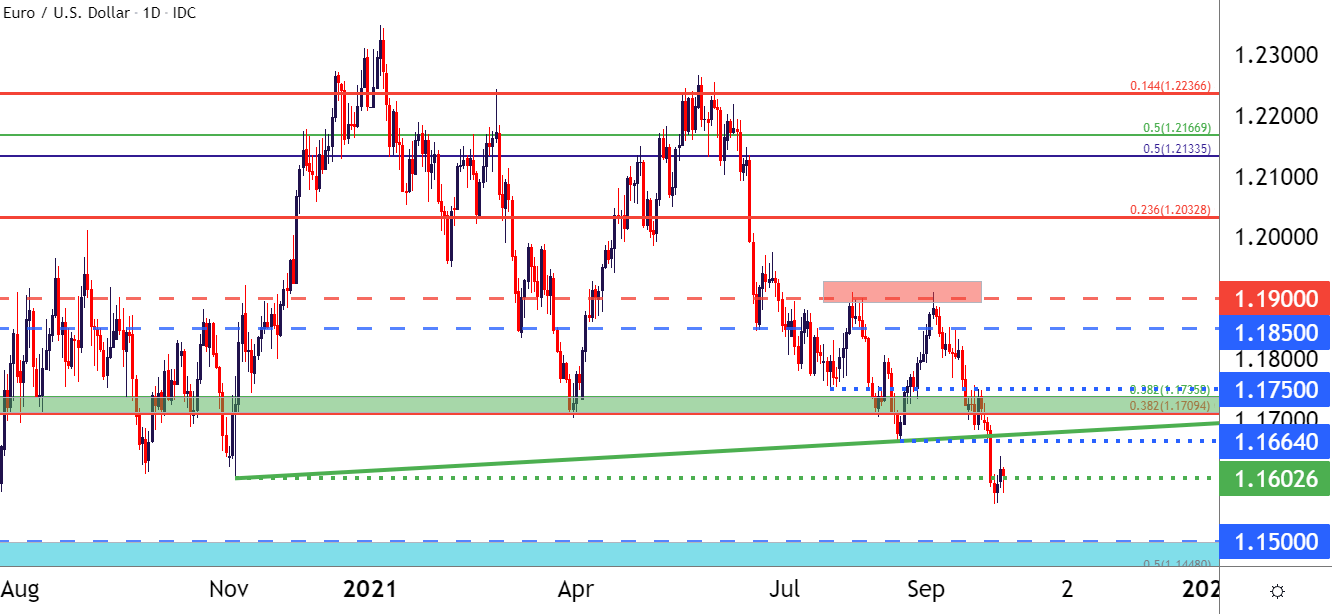
Chart prepared by James Stanley; EURUSD on Tradingview
GBP/USD Already Back to Resistance
GBP/USD experienced a similar breakdown as EUR/USD last week, setting a fresh 2021 low as the US Dollar was breaking out.
The big difference here is how strong the corresponding pullback has been. While EUR/USD simply stalled at those fresh lows, GBP/USD went to work, starting to trend higher and continuing to do so into this morning’s trade.
At this point, GBP/USD price action is right back to the key zone of Fibonacci support-turned-resistance, and this runs from 1.3649-1.3678. Given the few days until NFP comes into the equation, there could be some two-way opportunity here: For those that are really bullish USD and are looking for that Dollar strength to come back before NFP comes into the equation, the resistance here in GBP/USD could be compelling. For those that are looking for the USD to give back more gains ahead of NFP, the short-term bullish trend in GBP/USD could remain workable, and this can allow for a deeper drive within resistance or perhaps even beyond that key zone.
GBP/USD Hourly Price Chart
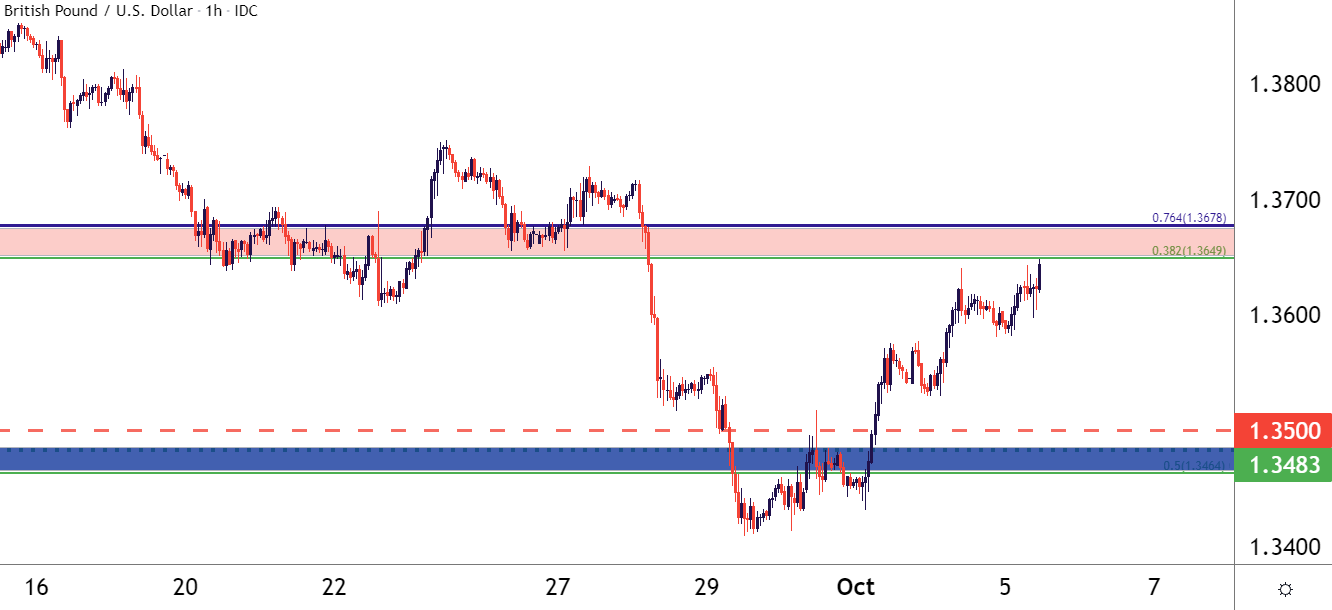
Chart prepared by James Stanley; GBPUSD on Tradingview
AUD/USD Back at Resistance
AUD/USD notably did not put in a fresh yearly low during the USD breakout last week: Instead the pair held above the swing-low set in August and as the US Dollar has pulled back, AUD/USD has shot right back up to a resistance zone that’s been in-play numerous times over the past two weeks. This zone runs from around .7290-.7317, with each of those levels being derived from Fibonacci retracements.
Given the return to a prior resistance zone, this setup shares some similarly with GBP/USD above; but there may be more of a lean into bullish breakout potential ahead of NFP here than with Cable. The reason being the frequency of those resistance tests, as this zone has been under fire for a couple of weeks now.
If we are going to see a greater pullback in the USD ahead of NFP, the topside in AUD/USD could be a touch more attractive given that fact, and also the fact that the pair did not post a fresh 2021 low last week while GBP/USD did.
AUD/USD Four-Hour Price Chart
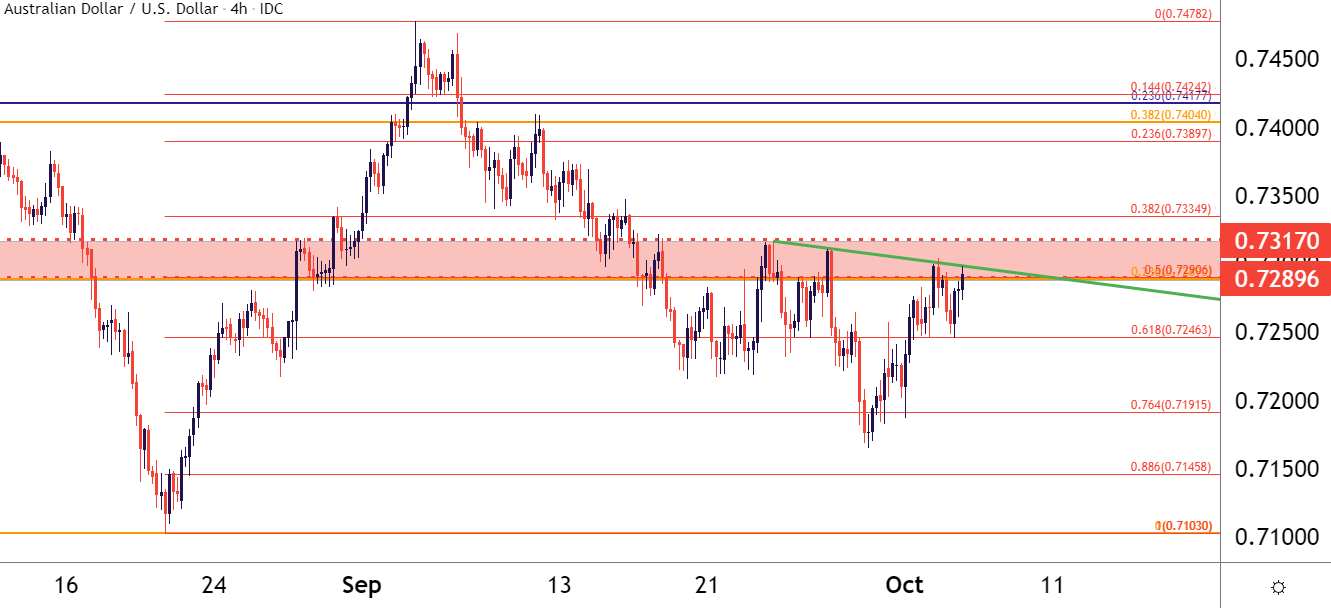
Chart prepared by James Stanley; AUDUSD on Tradingview
USD/JPY A Longer-Term Saga
I’m including USD/JPY because of interest around NFP. Ahead of that release, the pair may continue to exhibit sloppy short-term behavior, but on a longer-term basis, the pair is set up in a very interesting manner.
USD/JPY broke out last week, as well, setting a fresh 2021 high and rushing up for a test of the 2020 high; but buyers couldn’t make much ground beyond a big zone of long-term resistance. This zone runs from a Fibonacci level at 111.61 up to the psychological level at 112.50.
If we end up with a strong USD scenario after NFP, brought upon by a strong print and expectations for a taper announcement in November, USD/JPY may finally start to leave this resistance zone behind, and that could be a big deal considering this is the same spot that’s held bulls back in 2019, 2020 and, so far in 2021.
USD/JPY Weekly Price Chart
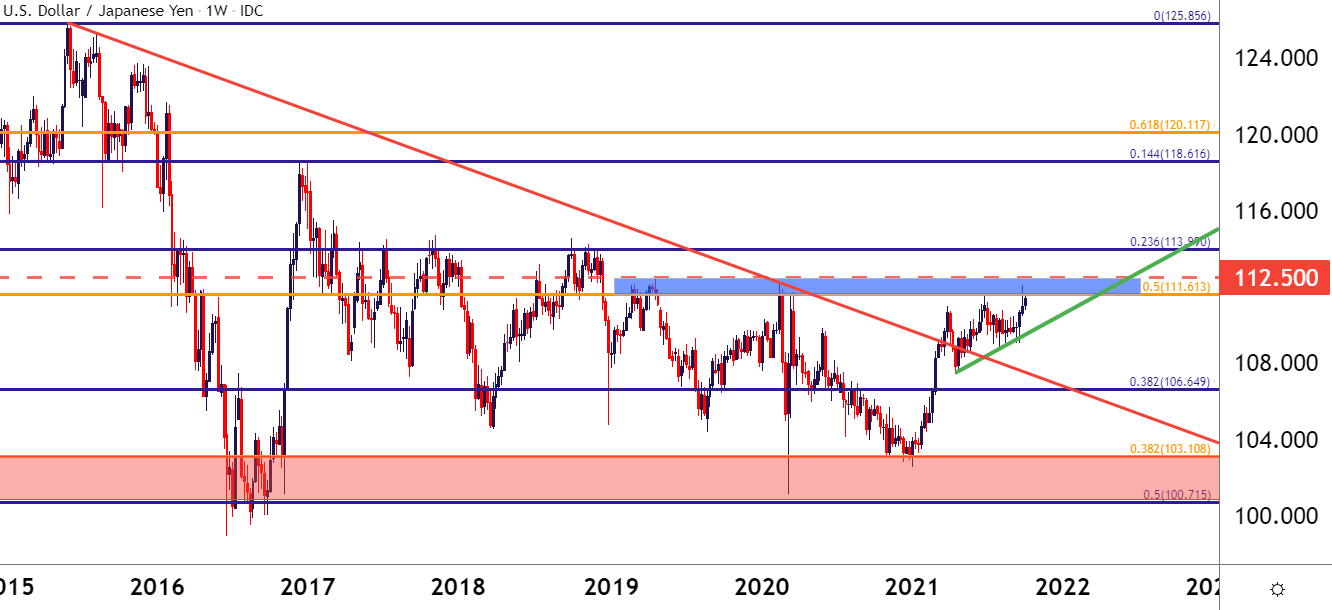
Chart prepared by James Stanley; USDJPY on Tradingview
--- Written by James Stanley, Senior Strategist for DailyFX.com
Contact and follow James on Twitter: @JStanleyFX


