


Canadian Dollar, USD/CAD, CAD Talking Points:
- USD/CAD is spiking higher after starting the week with a support test.
- US Dollar strength is the dominant theme across markets, running after last week’s FOMC rate decision warned of potentially faster rate hikes than previously anticipated.
- The analysis contained in article relies on price action and chart formations. To learn more about price action or chart patterns, check out our DailyFX Education section.
The US Dollar is continuing to run higher after last week’s FOMC rate decision. With the Fed upgrading their rate forecasts, there’s now more incentive for traders to be on the long side of the Greenback, and this has created ripple effects across the FX market as markets adjust to this new reality of a more hawkish Fed.
In USD/CAD, that move appeared delayed, however, and I had looked into the matter on Monday while highlighting a pair that was continuing to hold a big spot of support despite the fact that the USD was breaking out elsewhere, with the potential for an even greater topside move. That big spot of support wasn’t new either, as this was a zone that had been in-play in various ways throughout 2021 trade, helping to set support in the first week of the New Year and continually coming back into the equation since.
The zone in question runs from around 1.2622 up to 1.2635, with the former price being the 23.6% retracement of the long-term 2002-2007 major move. That zone is highlighted on the below chart in green.
To learn more about Fibonacci, check out DailyFX Education
USD/CAD Daily Price Chart
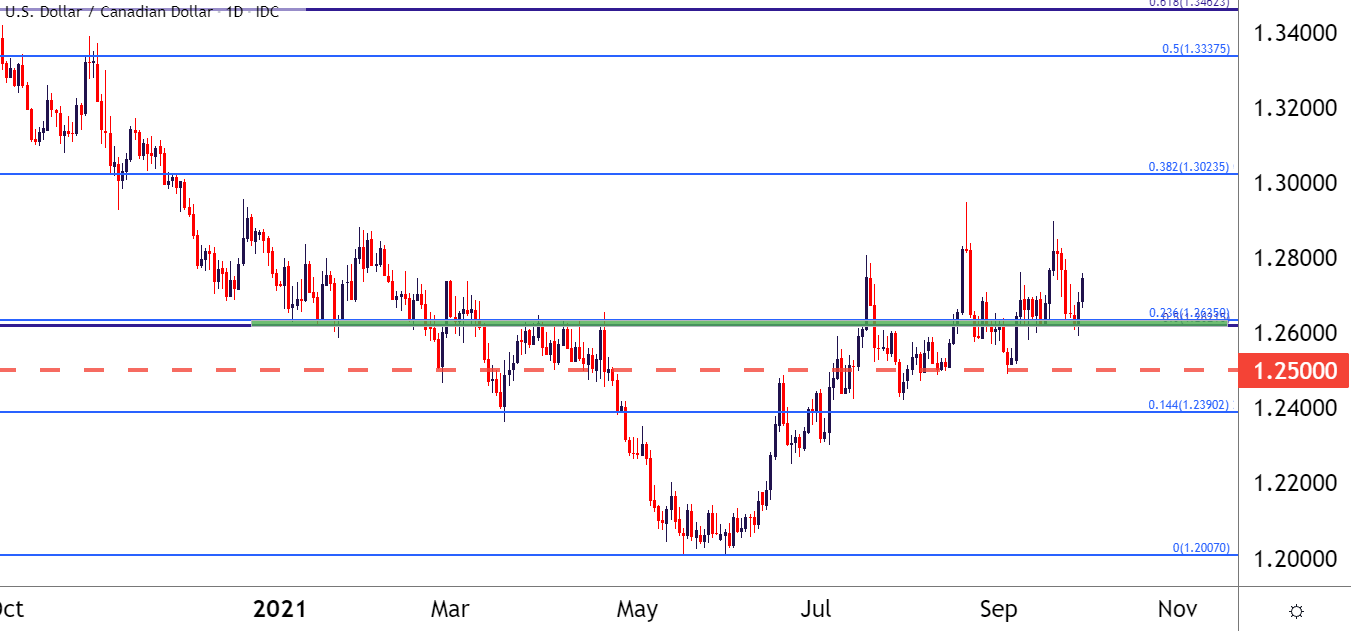
Chart prepared by James Stanley; USDCAD on Tradingview
In that article, I’d also highlighted a couple of topside targets for those next stops of resistance. The first of which has been traded through, at 1.2695. The second appears to be very near coming into play at 1.2762, which is just above today’s current high. Beyond that, the next big spot on the chart is the 1.2800 handle, after which both 1.2896 and 1.2949 remain of interest, on the way up to the 1.3000 psychological level.
For short-term scenarios, that prior spot of resistance around 1.2695 can be re-purposed as higher-low support potential for bullish continuation themes.
To learn more about psychological levels, check out DailyFX Education
USD/CAD Four-Hour Price Chart
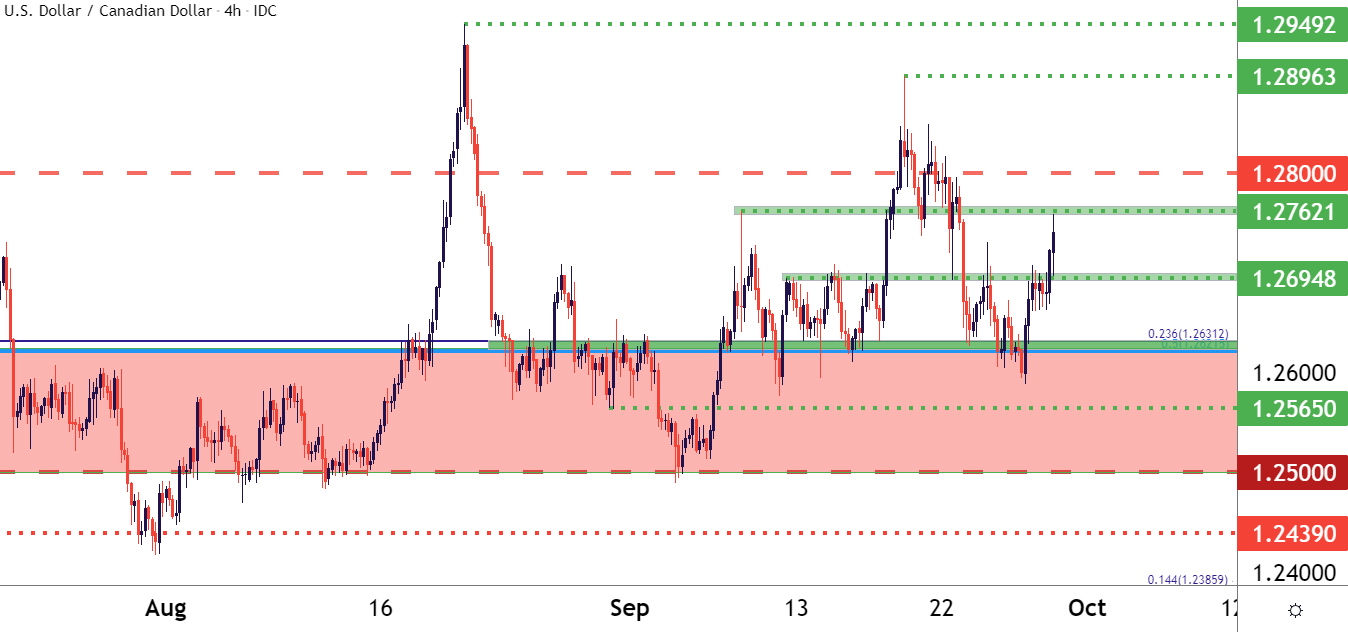
Chart prepared by James Stanley; USDCAD on Tradingview
--- Written by James Stanley, SeniorStrategist for DailyFX.com
Contact and follow James on Twitter: @JStanleyFX


