


S&P 500 Talking Points:
- Stocks have been on their back foot since last week, but the S&P 500 is catching a bounce today from Fibonacci support.
- Next week brings the FOMC and there’s likely a little caution here as the bank may begin to announce taper plans for 2021. But with the situation around Evergrande rising in importance, there’s now another risk factor for the Fed to contend with. Markets have seemingly shrugged off this risk so far.
- The analysis contained in article relies on price action and chart formations. To learn more about price action or chart patterns, check out our DailyFX Education section.
It seems almost blasphemous to ask when trends have been in full force for 18 months. But, are we finally at the point where prices put in a significant turn of 20% or more?
The key ingredient to this continued build has been constant and heavy support from the US Federal Reserve. But over the past few months the bank has been laying the groundwork for the start of tapering asset purchases, with the most recent word on the matter taken from the July FOMC meeting minutes. In that release, ‘most’ members felt it would be appropriate to begin tapering bond purchases by the end of the year.
And one look at the NFT market, or Non-fungible tokens, where pixelated jpeg images are selling for millions in cryptocurrency, combined with the other illustrations of froth that have been so present in US markets, and there’s understandable motive for the FOMC in trying to prevent the b-word from popping up (bubbles, that is).
But what makes the current situation so interesting is that, for the first time since the Global Financial Collapse, there’s a legitimate risk of contagion within the banking sector. Evergrande is a massive property developer in China, and there’s about 500 billion of risk there, 200 in assets and 300 in liabilities. By comparison, Lehman brothers was about 600 billion. But Evergrande is a property developer, and those assets aren’t as liquid as market securities, so as they sell assets to raise cash, they’re devaluing the very same assets that remain on their books that they may later want to sell for cash. Not to mention the collateral damage.
We’ve shrugged off what feels like a thousand risk episodes since the Global Financial Collapse, but perhaps we’ve run into a risk that can’t be summarily discounted in the same way, as contagion is a factor that a Central Bank may find considerably more difficult than buying bonds in an open market.
I had looked into this yesterday when talking about short-term setups on the Dow, S&P and Nasdaq.
On a bigger picture basis, the rally in the S&P 500 has been going on for 18 months now. And to put this in scope, this move has happened amidst a global pandemic, in which global governments have forced lockdowns and business closures. Normally this would be considered as a risk factor that might not be positive for equities. But, it has been, in a very, very big way.
On the weekly chart below, I’m pointing out a rising wedge formation which will often be approached with the aim of bearish reversals. We’re still holding support there at this point. But the 14.4% retracement of the pandemic move is all the way down at 4206, which is about 5.87% away from current price, as of this writing.
The 23.6% retracement, which would still keep the bullish trend in order, is down at 3987, so just inside of the 4k psychological level. A push down here would be a move of 10.77% from the current level. And the 38.2% retracement which, similarly, would keep the door open for bulls, is a whopping 18.53% away, and that would entail a total peak-to-trough move of 19.84% (from the Sept. high), which is bear market territory.
So, technically we could see a bear market develop while the bullish trend still stays in workable order.
To learn more about psychological levels, check out DailyFX Education
S&P 500 Weekly Price Chart
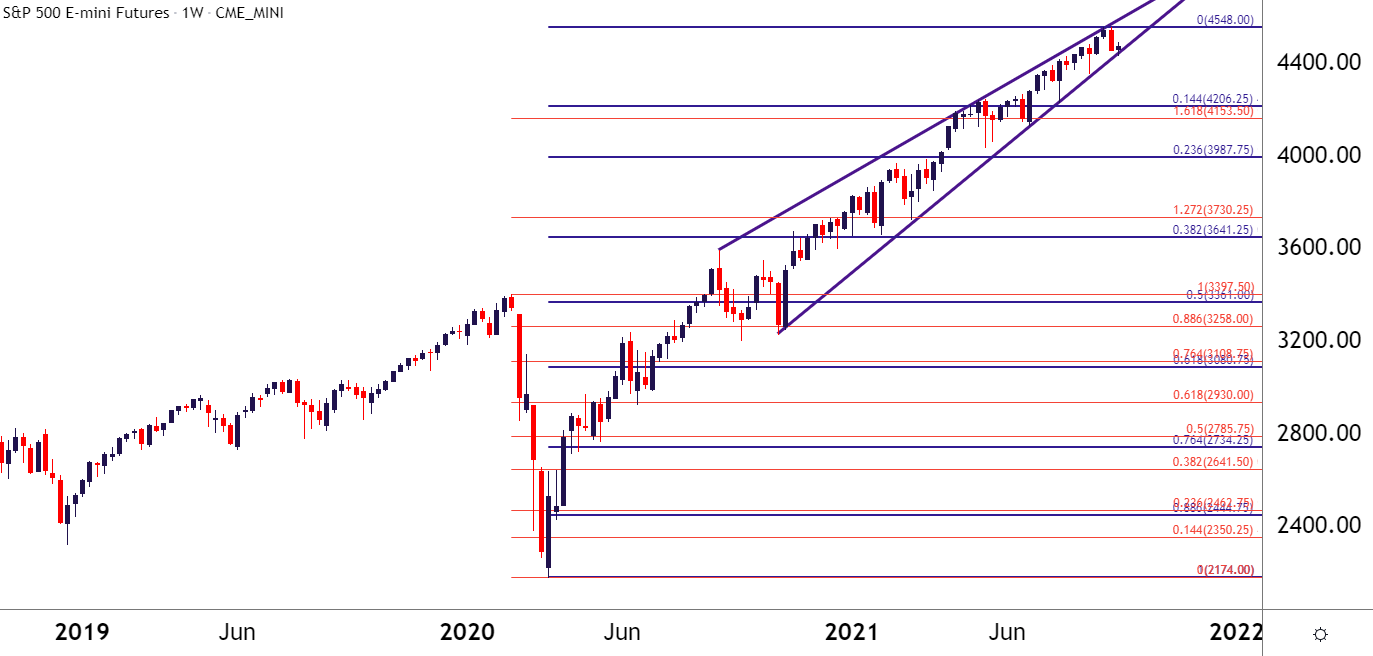
Chart prepared by James Stanley; S&P 500 on Tradingview
--- Written by James Stanley, Senior Strategist for DailyFX.com
Contact and follow James on Twitter: @JStanleyFX


