US Dollar, EUR/USD, GBP/USD, USD/CAD, CPI Talking Points:
- Tomorrow brings the release of August inflation numbers out of the US.
- The US Dollar came into the week with a resistance test, but prices have softened as the USD has pulled back, pushing the focus to tomorrow’s CPI report.
- The analysis contained in article relies on price action and chart formations. To learn more about price action or chart patterns, check out our DailyFX Education section.


As the world waited for taper, another risk popped up out of China with the announcement of troubles at Evergrande. And it doesn’t look like we’ve yet found resolution in that scenario, with recent reports suggesting that bond holders will be looking at a 70-75% hit. And when we’re talking $300 billion in debt, that’s potential capital destruction of more than $200 billion. But, perhaps more worrying, those counterparties that will be taking haircuts – well they owe creditors, too, and that could lead a domino effect, often just called contagion.
Whether or not that happens remains to be seen as we’re still in the early stages of the scenario, but capital markets remain cautious with the S&P holding near last week’s Friday lows.
But this week sees another risk factor re-enter the headlines as we’re seeing a number of high-impact inflation data releases. Tomorrow brings the US and the expectation is for inflation to have moderated from last month’s release (5.2% headline versus last month’s 5.3%, 4.2% Core CPI versus last month’s 4.3%). Wednesday brings UK and Canadian inflation numbers, and Friday brings European inflation to the forefront.
To learn more about CPI and how it Affects Currency Prices, check out DailyFX Education
It’s the US data that’s most interesting, as this will be the final CPI print before the Fed’s September rate decision. And with expectations high for some news on how the bank might be looking to taper asset purchases, expect heavy focus on this print, with the US dollar retaining some vulnerability ahead of the release.
At this point, the US Dollar remains range-bound in the bigger picture, following a resistance hit at the 92.80-92.90 zone that I’ve been following. Nearby support is at 92.46, and below that is a secondary zone running from around 92.20-92.26. On the resistance side of the coin, beyond the current zone is secondary resistance potential around 93.19 and beyond that is a Fibonacci level around 93.43.
US Dollar Four-Hour Price Chart
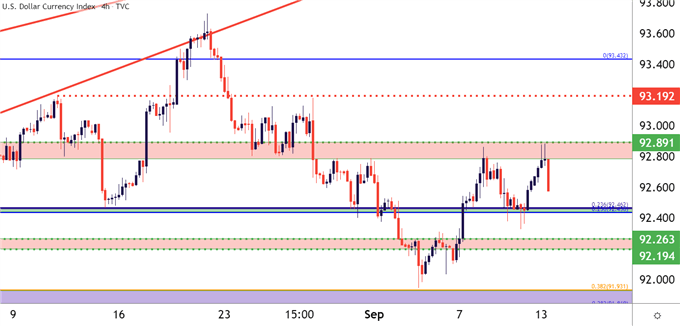
Chart prepared by James Stanley; USD, DXY on Tradingview
EUR/USD Pulls Back After Fresh Low
There was an ECB rate decision last Thursday, and EUR/USD was selling-off in advance, and that continued through the announcement. This week’s open saw continuation of that move as prices broke below support and set a fresh two-week-low at 1.1769.
The resistance zone in the pair around the 1.1850 area could become interesting, particularly if the US Dollar digs into support at the 92.46 spot on the chart. Beyond that is a key resistance zone, spanning from 1.1885-1.1900, and this seems to sync with the approximate area of support on DXY around 92.20-92.26.
Euro inflation is set to be released on Friday.
EUR/USD Four-Hour Price Chart
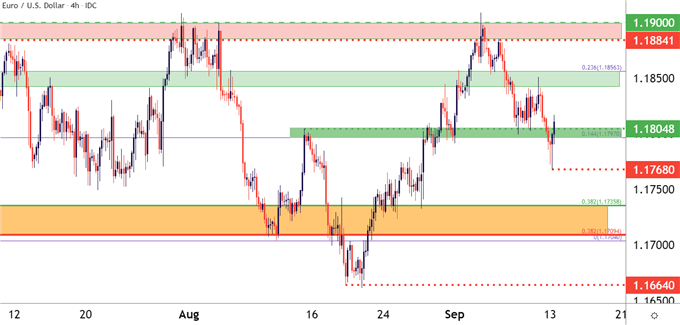
Chart prepared by James Stanley; EURUSD on Tradingview
GBP/USD Back up to Resistance – Breakout Potential
For bearish USD scenarios, I remain partial to GBP/USD. The pair has been playing inside of the levels looked at two weeks ago, with yet another resistance inflection off of the Fibonacci level at 1.3879; and then another show of support in the zone with the 1.3750 psychological level up to the 1.3768 prior price action swing.
A breach of 1.3900 opens the door for a run up to the 1.3950 level; after which the 1.4000 psychological level comes back into play.
To learn more about Fibonacci or psychological levels, check out DailyFX Education
GBP/USD Four-Hour Price Chart
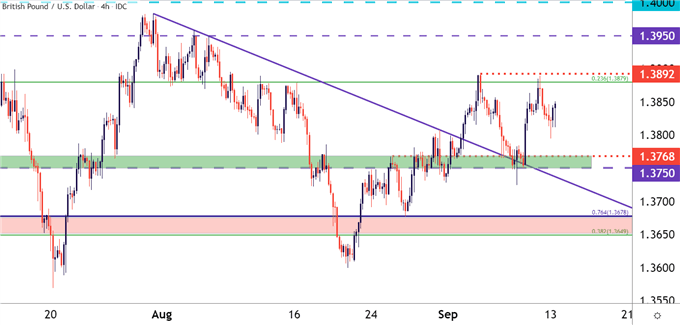
Chart prepared by James Stanley; GBPUSD on Tradingview
USD/CAD Holds Above a Key Zone
Last week was also big for Canadian economic data: The Wednesday BoC rate decision led into the Friday jobs report out of Canada. As looked at on the Friday prior, price action in USD/CAD was hanging on to support by a thread, around the 1.2500 psychological level.
But that support held through last week’s open and CAD-weakness was a prominent theme with BoC, helping the pair to push back above the 1.2622 Fibonacci level. There’s another Fibonacci level nearby, plotted at 1.2631, which is the 23.6% retracement of the 2020-2021 sell-off.
Also of consideration is the bullish trendline that originated back in June, and still has an impact on intra-day price action dynamics.
To learn more about drawing trendlines, check out DailyFX Education
USD/CAD Eight-Hour Price Chart
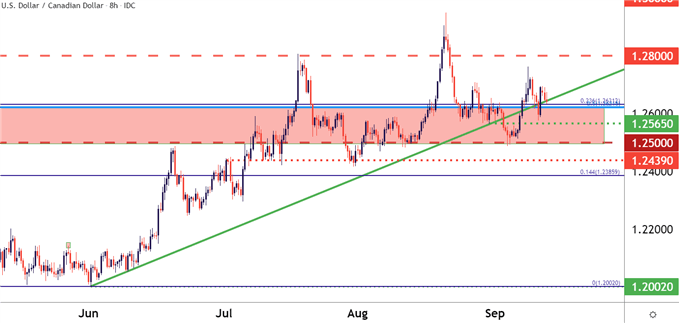
Chart prepared by James Stanley; USDCAD on Tradingview
--- Written by James Stanley, Senior Strategist for DailyFX.com
Contact and follow James on Twitter: @JStanleyFX


