


US Dollar Talking Points:
- Last week saw a significant move in the US Dollar, with the Greenback jumping by more than 2.5% around the FOMC rate decision.
- This week sees the US currency remain in the spotlight: Friday brings the release of PCE, the Fed’s preferred inflation gauge. But there’s a plethora of Fed-speak punctuating the calendar ahead of that data release.
- The analysis contained in article relies on price action and chart formations. To learn more about price action or chart patterns, check out our DailyFX Education section.
We’re still working through the aftermath of last week’s FOMC rate decision. While it’s now been almost a week since that event happened, the Greenback put in a very noticeable change-of-pace around the announcement that, as yet, hasn’t reversed. While strength has returned in stocks and even with Treasury yields continuing to drive-lower, the US Dollar remains fairly elevated after last week’s spike.

Yesterday brought a bit of pullback to that theme, and bulls promptly returned upon a test of a key support zone to push prices back up towards the highs. Later today, we’ll get a speech from FOMC Chair, Jerome Powell, and the remainder of the week is punctuated by a chorus of Fed speakers that, likely, will continue to highlight caution around forecasts as there’s still a brutal amount of unknown with regards to inflation and USD price trends.
The key support that’s currently in-play is bound between a couple of Fibonacci levels, plotting at 91.82 and 91.93. The latter of those prices is the 38.2% retracement of the 2021 Q1 spike in the USD, and the former is the 38.2% retracement of the 2011-2017 major move.
To learn more about Fibonacci, check out DailyFX Education
US Dollar Daily Price Chart
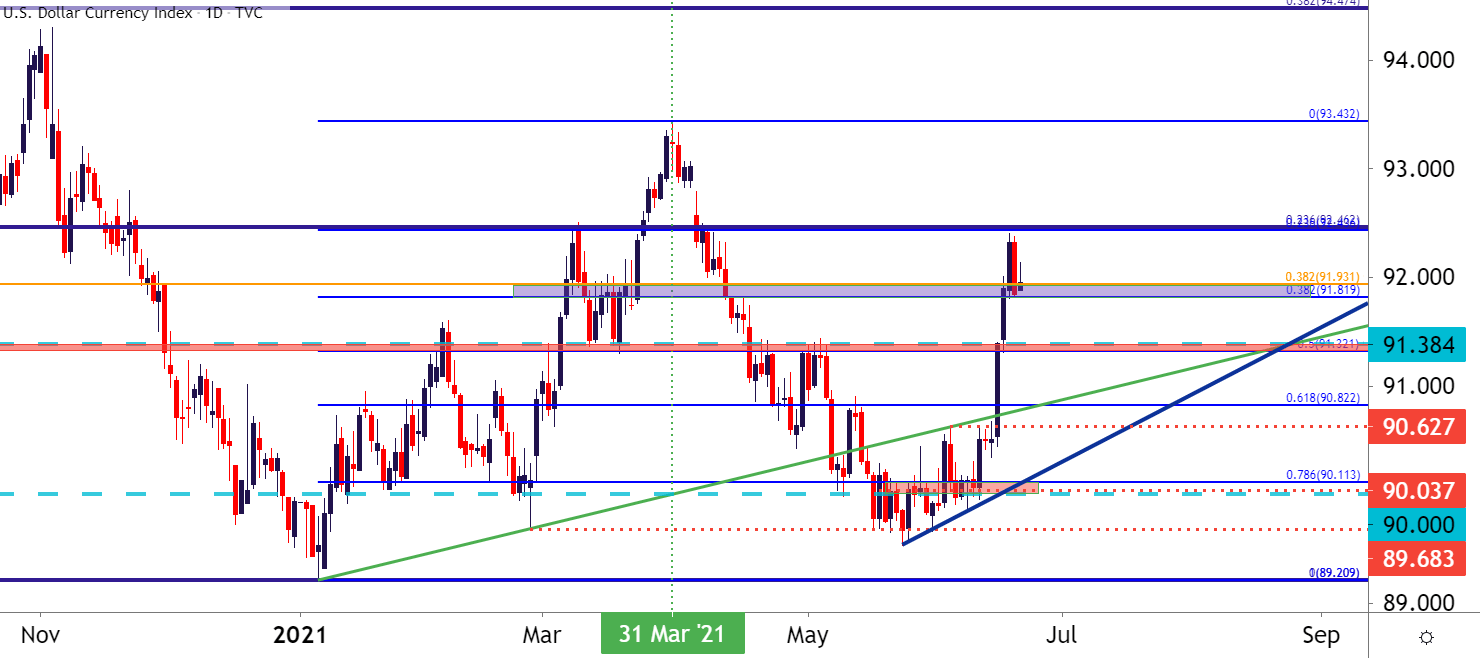
Chart prepared by James Stanley; USD, DXY on Tradingview

Taking a shorter-term look at the matter and we can see where this zone came into play overnight to help hold higher-low support. The bounce thus far has been relatively small and buyers haven’t yet been able to punch up to a fresh high, so the current item is to watch whether this support zone can hold the lows ahead of new highs and, if not, the look then moves towards a deeper area of support. Such potential exists in the chasm between 91.32 and 91.38, the former of which is the 50% marker of the same Q1, 2021 bullish spike in the USD. This zone is shown in red on the below four-hour chart.
US Dollar Four-Hour Price Chart
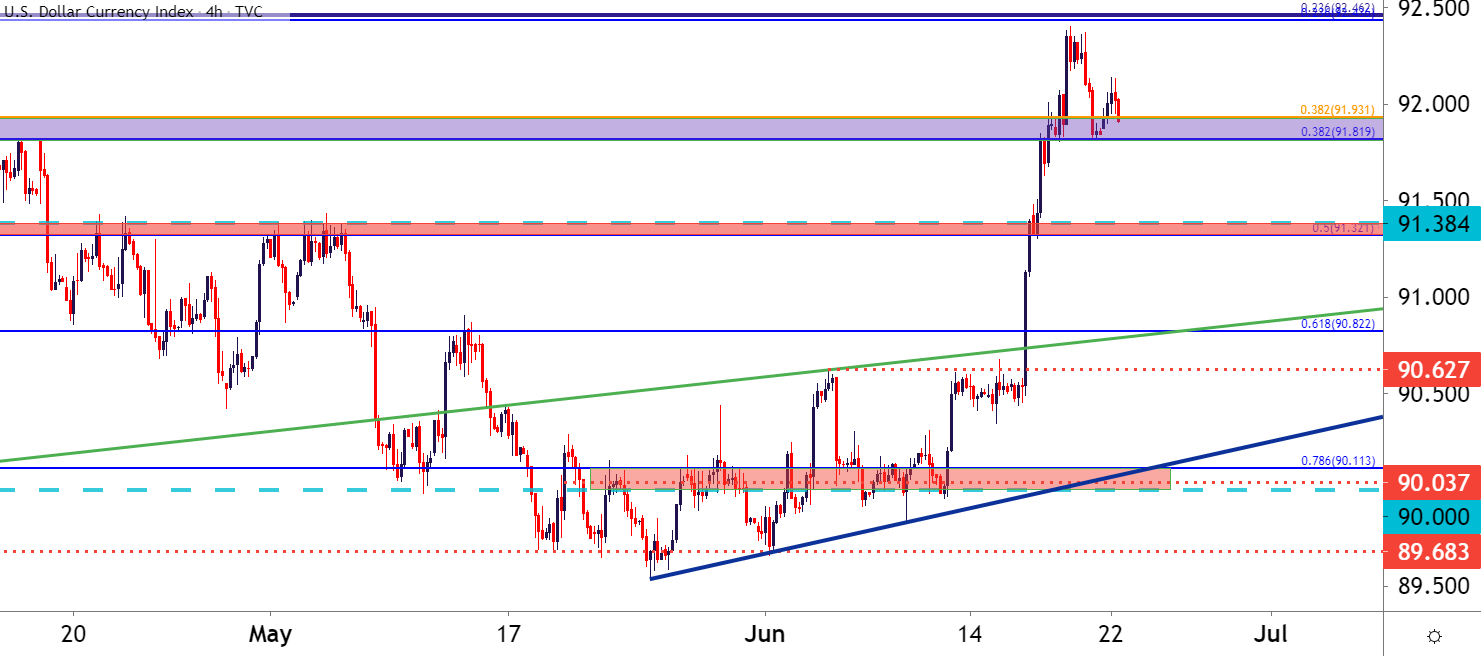
Chart prepared by James Stanley; USD, DXY on Tradingview
--- Written by James Stanley, Senior Strategist for DailyFX.com
Contact and follow James on Twitter: @JStanleyFX


