


Bitcoin, Ethereum, BTC/USD, ETH/USD Talking Points:
- While many/most markets close over the weekend the crypto space does not sleep, and with Ethereum futures going online next week, this may be a busy weekend in cryptocurrencies.
- Ethereum has launched higher this week, setting a fresh all-time-high ahead of that futures listing.
- Bitcoin was strong as well, albeit to a lesser degree than that of Ethereum. Perhaps most impressive was the continued strength in Bitcoin even as the US Dollar came back to life.
- The analysis contained in article relies on price action and chart formations. To learn more about price action or chart patterns, check out our DailyFX Education section.
The crypto space continues to evolve and next week marks another key point on that timeline when Ethereum futures contracts go live. In anticipation of the listing, Ethereum rallied throughout the week to continually punch up to even higher all-time-highs. At this point, Ethereum is up more than 130% in 2021 alone, and we’re barely a month into the New Year.
Perhaps more impressively the cryptocurrency has rallied by as much as 1859% from the March 2020 lows, and as much as 473% from the September lows. Bitcoin, of course, has had its days in the sun but the numbers fail to compare to Ethereum, and this can be seen in the continued fall in the Bitcoin/Ethereum spread, which fell to a fresh two-year-low earlier this week and has been running-lower for much of the time since peaking in September of 2019.
Bitcoin/Ethereum Highlights Ethereum’s Growing Presence in the Crypto Space

Chart prepared by James Stanley; Bitcoin/Etherum on Tradingview
Ethereum Jumps Up to Fresh All-Time-High
Coming into this week, Ethereum had already spent two weeks testing resistance at the prior all-time-high, which was set in 2018 at a price of $1,420.00. That level was tested each of the past two weeks but this week, bulls accelerated through to push the market all the way past the $1700 marker.
The fresh high, plus the major change next week with the listing of Ethereum futures contracts presents some significant change and possible turbulence to deal with. There’s no sign yet of this breakout reversing; but traders would likely want to remain cautious as anytime something that large is changing in a market, the range of possible outcomes similarly shifts to a much wider base of potential.
Ethereum Weekly Price Chart: Acceleration Up to Fresh All-Time-High
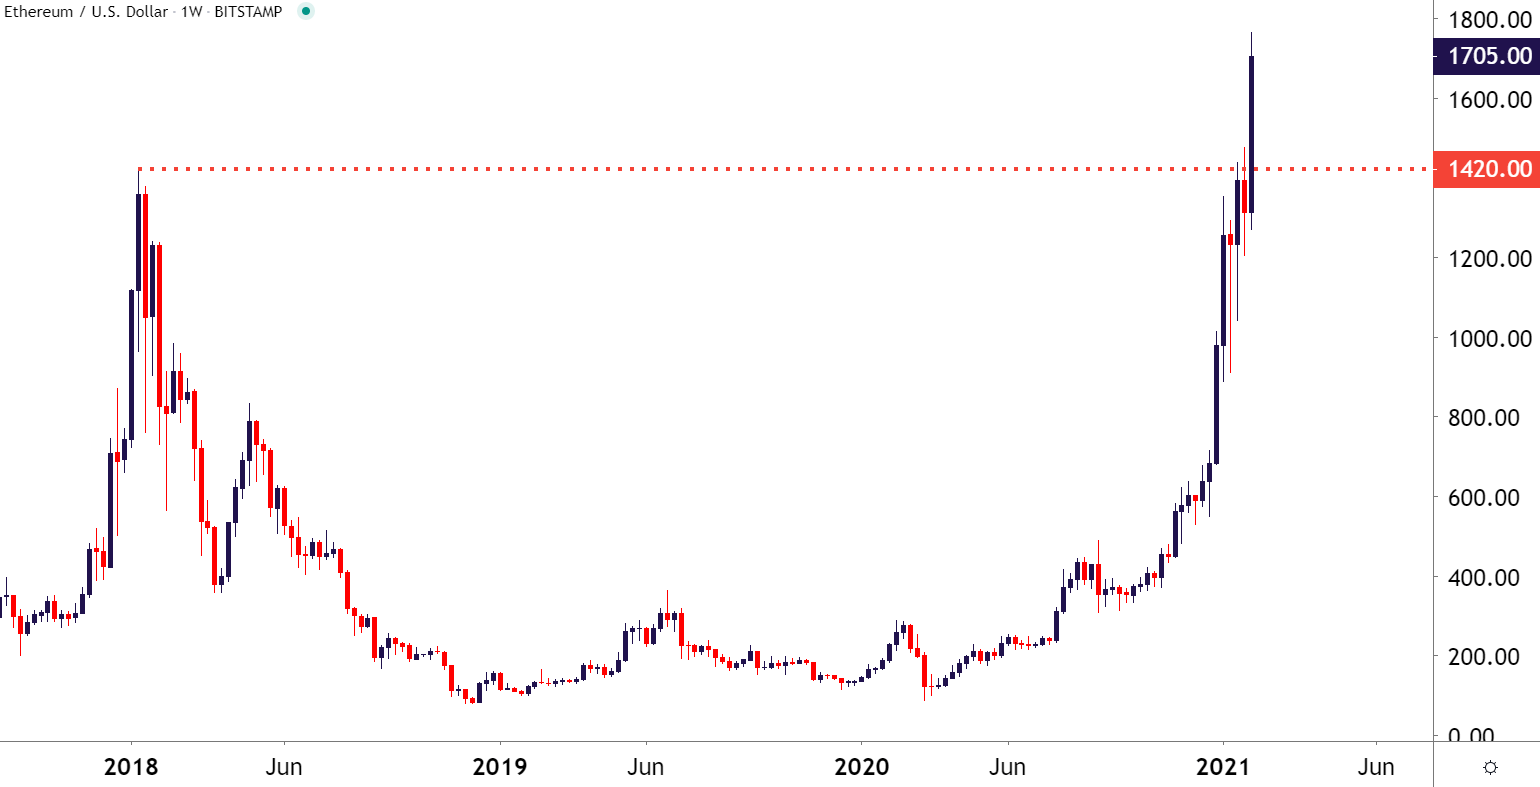
Chart prepared by James Stanley; Ethereum on Tradingview
Should Ethereum pull back, there could be some possible opportunity for analysis to enter the equation. The prior batch of resistance, from around 1,420 up to 1476 could be looked at as potential support as taken from prior resistance.
Ethereum Four-Hour Price Chart
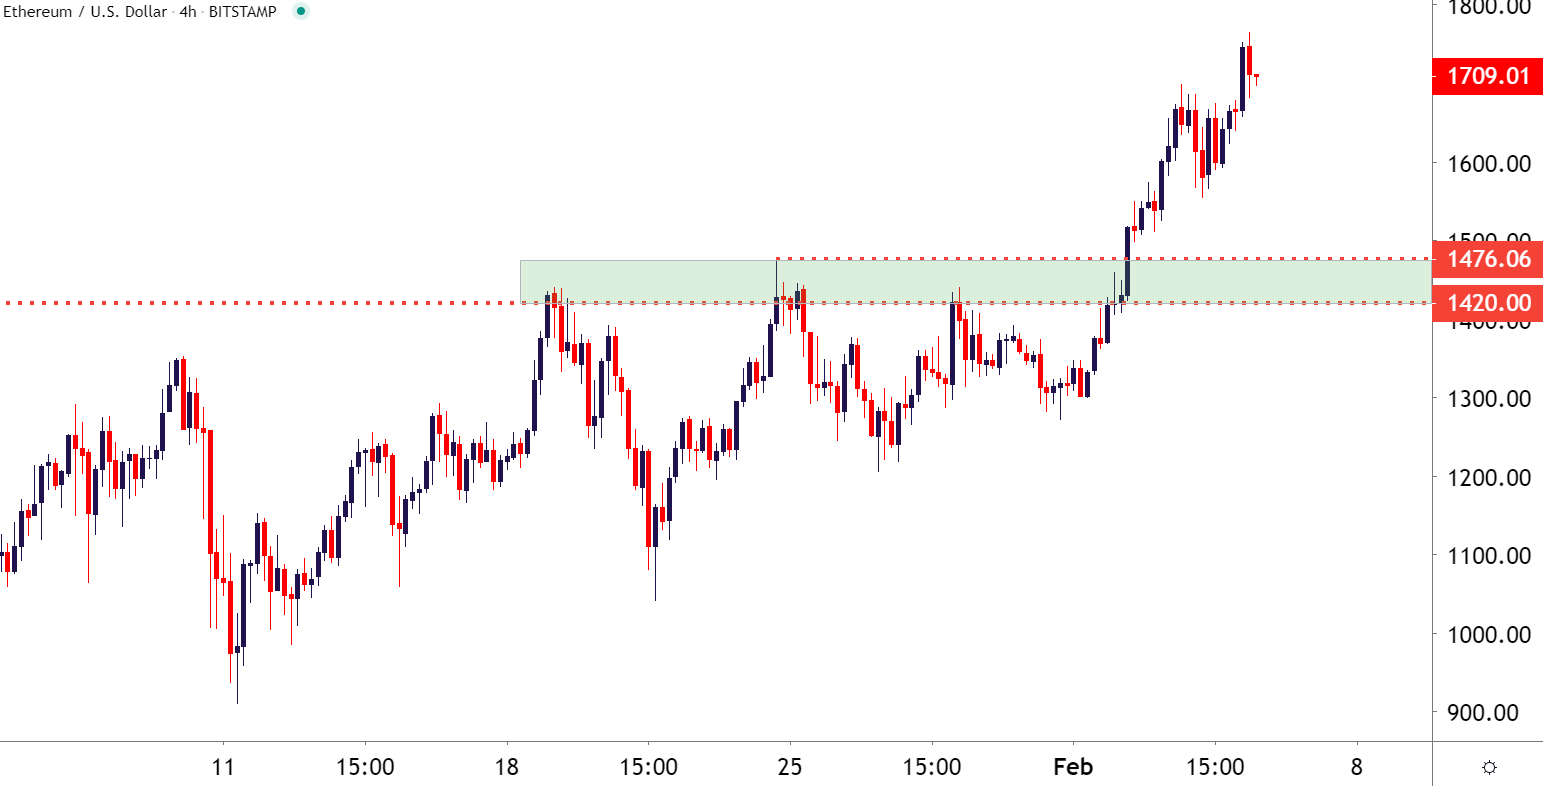
Chart prepared by James Stanley; Ethereum on Tradingview
Bitcoin Bounces Even as USD-Strength Begins to Show
Despite the lackluster performance when compared to Ethereum this week, it was also a strong week for Bitcoin, even as the US Dollar showed its own strength. Bitcoin set a fresh three-week-high on Thursday morning before pulling back. That high showed up at a familiar spot on the chart, around the same 23.6% Fibonacci retracement that helped to evoke resistance at the end of last week. That Fibonacci retracement comes from the 2021 major move, taking the low from January 4th up to the high set on January 8th.
The 38.2% marker from this same retracement has also helped to set support on Thursday after showing resistance on Tuesday; and this set of levels is shown in Green on the chart below.
Bitcoin Eight-Hour Price Chart
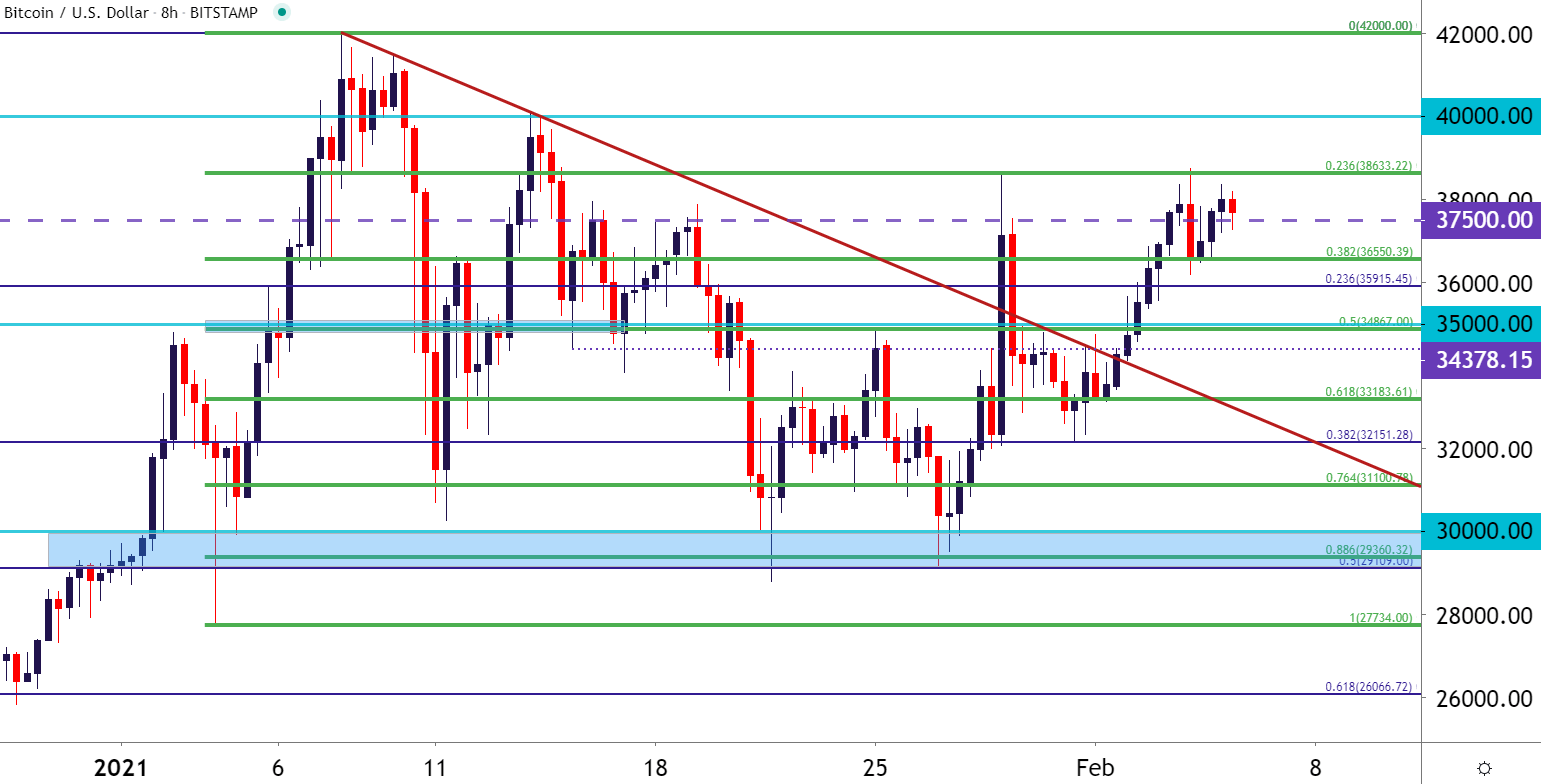
Chart prepared by James Stanley; Bitcoin on Tradingview
The posturing around resistance and the failure to retest the 40,000 handle after the Thursday inflection are both non-bullish factors; but the door does remain open to strength, particularly if that high around the 23.6% Fibonacci retracement is tested again. A recurrent test and a breach up to a fresh high opens the door for breakout potential into the 40,000 handle; and if buyers can continue to push, then the all-time-high at 42,000 remains vulnerable.
The pace of recent higher-lows combined with horizontal resistance presents an ascending triangle formation, which will often be approached with the aim of bullish breakout potential. To learn more about that formation, check out DailyFX Education.
BTC/USD Eight-Hour Price Chart

Chart prepared by James Stanley; Bitcoin on Tradingview
--- Written by James Stanley, Senior Strategist for DailyFX.com
Contact and follow James on Twitter: @JStanleyFX


