


Gold, XAU, Gold Price Analysis:
- Gold prices set a fresh all-time-high on Monday of this week.
- With an FOMC rate decision on the calendar for today, this theme will likely remain in the spotlight.
- Gold prices are making a move for a first-ever test of the 2k psychological level. Will this produce a pause in the trend, with a potential pullback to support around prior resistance?
Gold Prices Punch Up to Fresh All-Time-High
Well, it finally happened; and it only took 8 years. Gold prices have set a fresh all-time-high, breaking out this week to extend the precious metal’s bullish advance that started in the second-half of 2018. And, perhaps more accurately, Gold didn’t just set a fresh all-time-high, it surged right to it, soundly taking out the prior high water mark of 1920 on Monday and continuing to rally through Tuesday to a fresh high at 1981.20.
The big question now is the 2k marker and when Gold bulls might be able to muster the momentum for a first-ever test of that big figure.
Gold Monthly Price Chart

Chart prepared by James Stanley; Gold on Tradingview
FOMC Looms Large, but Can it Bend the Trend?
The bullish theme in Gold has been going for almost two years now, sparking in the second-half of 2018 and really coming alive throughout last year as the Fed shuffled into a more dovish position. And coming into 2020, it appeared as though the Fed would continue moving to softer monetary conditions, which was one of the main reasons I looked at the bullish side of Gold as my ‘top idea for 2020,’ shared in the guide below.

And while the Fed has grown considerably more dovish throughout 2020 trade, there’s likely nobody that could’ve predicted the driver for such a move. The fact that the coronavirus pandemic has roiled economies around-the-world, bringing along expectations for years of soft monetary policy, that bull argument for Gold has only grown stronger, leading to some of the most overbought conditions ever seen in Gold prices. But, as discussed numerous times in the recent past, the big question is how much that matters, as there’s been a clear driver pushing the bid in Gold and, at this point, there’s little reason to expect that to change.
The near-term complication is that 2k level. Will buyers be able to pick up the pace with price action beyond that major psychological level that’s literally never been in play before? Or, will this provide some element of pause for the move, allowing for price action to pullback; potentially finding support at a prior area of resistance?

There are a few key spots of interest for such a theme, key of which is the prior all-time-high of 1920; and the 1900 psychological level can potentially be of interest, as well. On the topside of price action, there could be breakout opportunities on pushes up to fresh highs, looking for prices to make a move towards that 2k psychological level. But the proverbial rubber band is pulled back with this outsized breakout in Gold, so traders on either side of the matter should remain cautious in the near-term as volatile price moves can remain.
Gold Four-Hour Price Chart
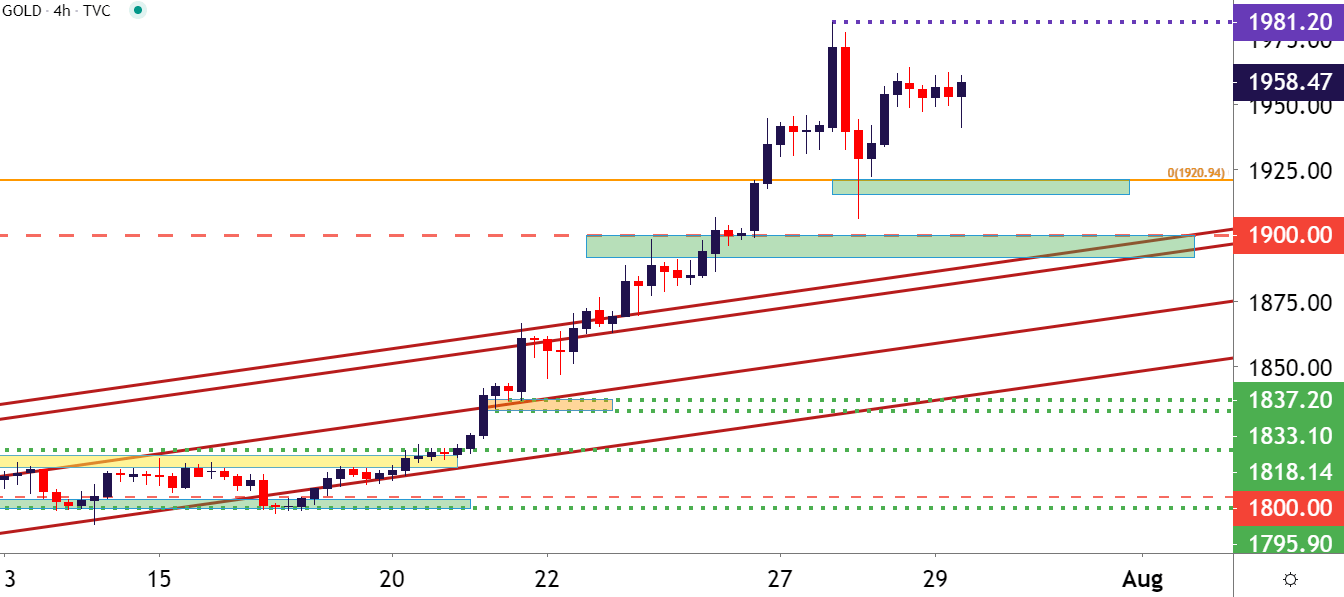
Chart prepared by James Stanley; Gold on Tradingview
--- Written by James Stanley, Strategist for DailyFX.com
Contact and follow James on Twitter: @JStanleyFX


