


Euro Price Analysis:
- Tomorrow’s economic calendar brings a rate decision from the ECB, set to take place at 7:45 AM ET with the accompanying press conference kicking off at 8:30 AM ET.
- While little is expected around tomorrow’s ECB rate decision, the EU Summit may be more eventful or contentious for financial markets.
- Ahead of the drivers, EUR/USD has pushed up to a fresh four-month high, testing a key zone of resistance along the way. Thus far, buyers have been held at bay by this area on the chart, setting up an interesting backdrop in the pair and the Euro for the coming days.
EUR/USD Tests Key Resistance Ahead of ECB, EU Summit
The stage is setting up for the Euro and earlier this morning, EUR/USD pushed up to a fresh four-month-high, finding resistance in the lower-portion of a zone that’s been in-play going back to 2018. I had looked into this in yesterday’s webinar, relating the bullish move in EUR/USD to the bearish move in USD.
In EUR/USD, the big zone of resistance referred to above spans from 1.1448 up to the 1.1500 psychological level. The latter of those prices is taken from the 2017-2018 major move with 1.1448 being the 50% marker. This zone first came back into the equation in May of 2018 as the Euro was selling off on the back of rising political risk. This was shortly after that M5/Matteo Salvini wins in Italy as global market participants geared up for a debt standoff between Rome and Brussels.

That zone slowed the sell-off, first coming into play in May but finally giving way in November of 2018. A late-year rally saw prices firm but this area soon became resistance, and after an inflection in March of last year prices sold-off and didn’t return until a year later.
EUR/USD Weekly Price Chart
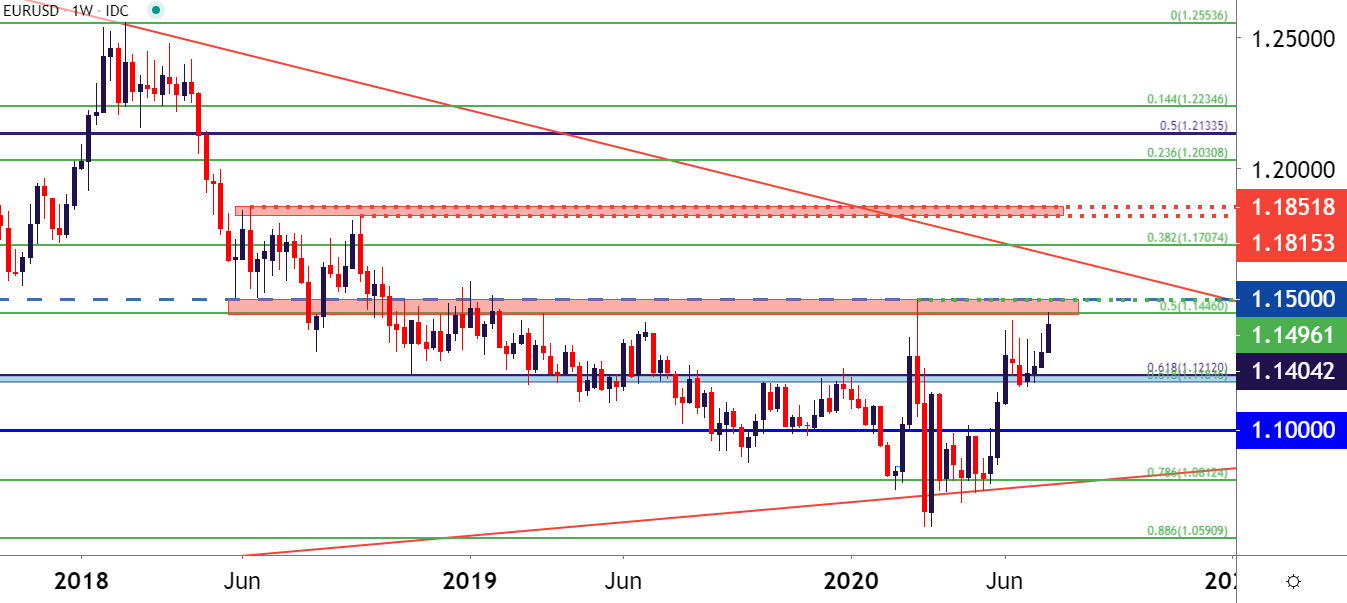
Chart prepared by James Stanley; EUR/USD on Tradingview
It was the test of that zone a year later that remains of interest. In the month of March, as the coronavirus was being priced-in, the US Dollar quickly dropped as expectations were gearing up for softer policy out of the US Federal Reserve. In short order the USD was trading at fresh yearly lows and EUR/USD at fresh yearly highs.
Price action jumped into the 1.1448-1.1500 zone, and buyers even drove for a bit. But – they slowed down before 1.1500 came into play and the high ended up showing just 4 pips shy of the psychological level. That’s around that time that USD-strength came screaming back, and EUR/USD folded-lower in response, quickly rushing down to a fresh yearly low just two weeks after setting the high.
Now, four months later, that big resistance zone is back in play. And there are two large drivers sitting ahead with tomorrow’s ECB rate decision and the EU Summit. Is now the time that bulls can push through this resistance zone, crafting a fresh yearly high in the EUR/USD?
EUR/USD Daily Price Chart

Chart prepared by James Stanley; EUR/USD on Tradingview
--- Written by James Stanley, Strategist for DailyFX.com
Contact and follow James on Twitter: @JStanleyFX


