


Gold Price Analysis:
- Gold has had a brisk start to Q3 as Gold prices have set a fresh eight-year-high.
- Today’s breakout has Gold flying past a couple of previously key resistance levels.
- Can Gold bulls muster even more strength? The answer to that is likely based around FOMC expectations and hints as to what might be around-the-next-corner.
Gold Breakout Takes Out 1800
It’s been a strong start to Q3 and H2 for Gold prices. After spending about two months in a rather consistent range during the second quarter, buyers began to push in late-June and as the page has turned into July, that strength has continued to show. This has allowed for Gold prices to set yet another fresh high, this time an eight-year-high as the 2012 swing at 1796 has now been traded through.
As looked at last week, July trade started off hot in Gold as bulls pushed up to a fresh high shortly after midnight eastern time; and this was followed by a quick pullback, with a show of support around prior resistance, taken from the swing high sitting at the approximate 1765 level. Since then, buyers have remained large and in-charge, helping to break the 1800 level on the way to those fresh eight-year-highs.
Gold Price Eight-Hour Chart
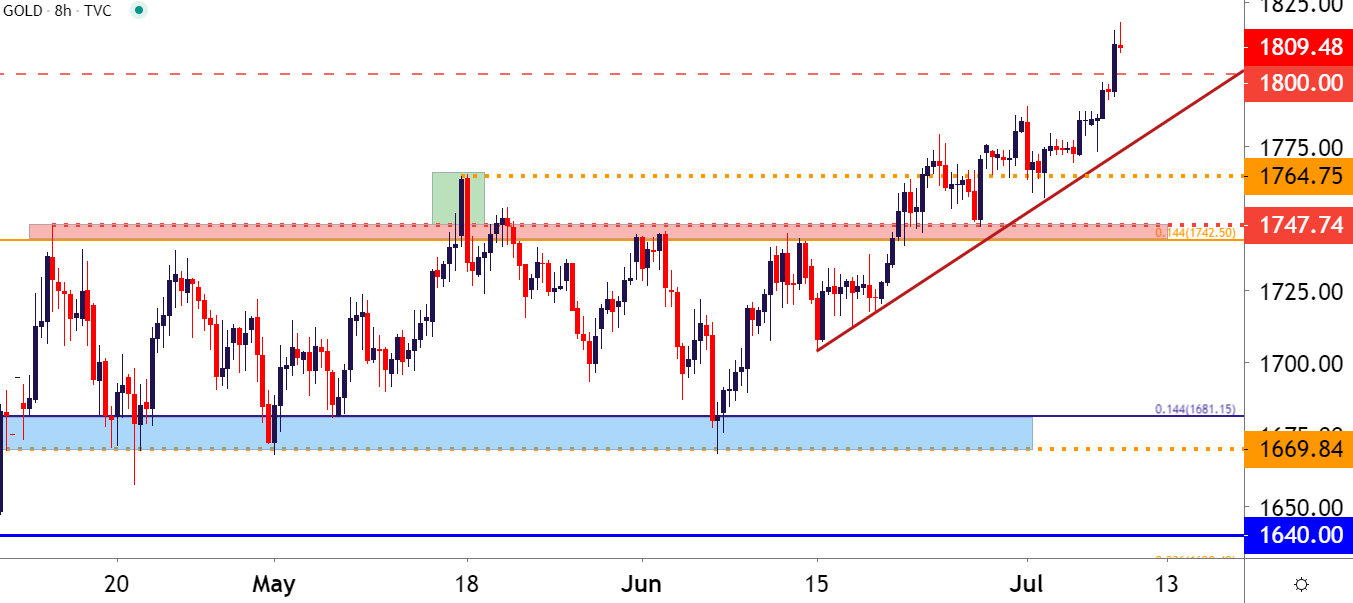
Chart prepared by James Stanley; Gold on Tradingview
Gold Prices Testing Key Area on Long-Term Charts
This recent bullish breakout has propelled Gold prices into some rarified air. It’s been quite a while since Gold has traded above 1800, and the last time this had happened, hopes remained that Gold prices would continue to gain similar to what had happened in the 2008-2011 backdrop. But, as the FOMC moved to normalize policy by, eventually hiking rates and reducing the balance sheet, Gold prices dropped from 2012-2015, and then spent much of the 2016-2018 period in various forms of mean reversion and range-bound activity. It’s been over the last seven quarters that Gold bulls have really taken control of the matter, and the below monthly chart highlights the importance of where price action is currently testing.

Gold Monthly Price Chart

Chart prepared by James Stanley; Gold on Tradingview
Gold Prices Drive as Expectations Around FOMC Remain Primed for Accommodation
There’ve been a few moments of import over the past four months that may help to highlight the focus on various themes. One of which was a comment from FOMC Chair, Jerome Powell, in which he said in a television interview that there was ‘no limit’ to what the Fed could do with the lending programs available to them. This interview aired shortly after a Sunday market open, after which Gold prices broke out, albeit temporarily, before retreating back into the range.
But – as noted around the time of that occurrence, this merely highlighted the potential for future Gold strength should expectations remain or, perhaps even build for even more accommodation out of the world’s largest national Central Bank, as the US looks to offset at least some of the coronavirus-related economic destruction.

So, despite the long-term overbought readings, there could be continued motive for bulls to follow the bid; similar to the way that stocks have remained almost stubbornly strong in the face of some rather dire economic data.
It’s not that the economy and the stock market are divorced: It’s more of the stock market being a manifestation of expectations while reality is, by nature, focused on the present. So, the big hope is that the Fed will prevent economic destruction from the coronavirus. The tools to do that would likely be even more accommodation, even more passive monetary policy and, possibly, a weak US Dollar that could continue to help drive Gold prices-higher.
For Gold bulls that are looking for strategy, the potential for support at prior resistance may be an attractive way of moving forward. That prior eight-year-high was around the 1796 level, and the 1800 level is a major psychological point. Collectively, that can produce a ‘zone’ of support that could allow for an area of bulls’ focus. Below that, the prior swing-high of resistance around 1787 may be looked at as an ‘s2’ area of support, with the prior swing around 1775 functioning as a type of ‘s3’ area of potential support.
Gold Price Four-Hour Chart

Chart prepared by James Stanley; Gold on Tradingview
--- Written by James Stanley, Strategist for DailyFX.com
Contact and follow James on Twitter: @JStanleyFX


