Dow, S&P 500, Nasdaq Price Analysis
- The bullish trend in the Nasdaq drove up to a fresh all-time-high yesterday.
- The Dow and S&P have been less bullish, as each has built in a pattern of digestion over the past week of price action.
Nasdaq Fresh Highs, Dow, S&P 500 Continue Consolidation
The bullish trend in the Nasdaq has continued as the index set yet another fresh all-time-high yesterday. This comes as new coronavirus cases continue to rise both in the US and globally; and even economic projections look pretty negative, with the IMF now expecting a global contraction of -4.9% this year versus their prior expectation for a 3% reduction. But, as has been the case, the driver appears to come from the deductive, and the fact that any economic weakness in the weeks or months ahead may be met with even more stimulus from global governments. As a reminder, it was just earlier this month that Fed Chair Jerome Powell said that there were ‘no limits’ to what the Fed could do with the liquidity programs available. This sounds very similar to a ‘Fed put’ in which the bank will look to address weakness or pressure with even more loosening.
In equities, this has helped the recovery continue from those March lows that now seem so far away. The Nasdaq has been the outperformer amongst American equity indices for much of this time, as the pullback in February-March opened the door for investors to pick up formerly high-flying tech stocks at a lower multiple. The likes of Apple, Amazon, Alphabet, Facebook and Netflix make up a large portion of both the S&P 500 and the Nasdaq; and this has certainly been a factor in equity performance over the past few months.
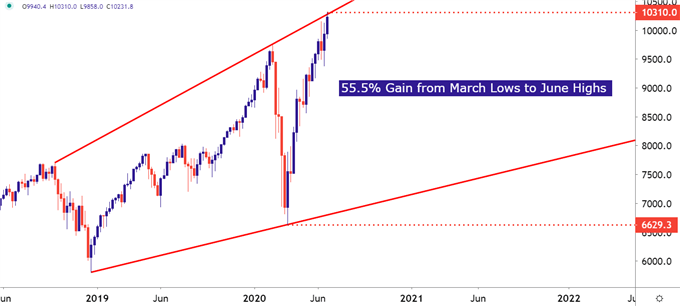
The Nasdaq 100 has gained as much as 55.5% from the March lows. A huge number in any full year, much less over a quarter as a global pandemic rages on.
Nasdaq 100 Daily Price Chart

Chart prepared by James Stanley; Nasdaq 100 on Tradingview
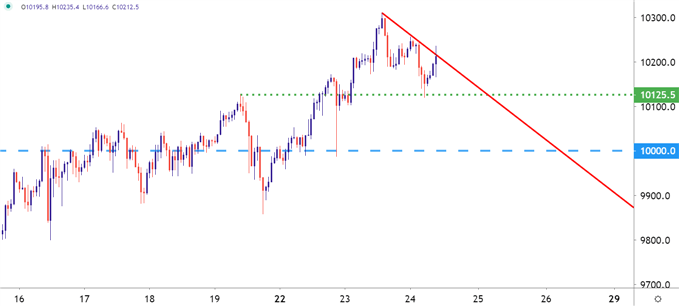
From the hourly chart below, we can observe the shorter-term observation of recent trend continuation. After setting a fresh high yesterday, prices pulled back overnight, eventually finding a bit of support around a prior point of resistance. While short-term price action has also offered lower-highs, given proximity to the 10k level in the index, the big question is whether buyers can continue this bullish trend up to fresh all-time-highs.
Nasdaq 100 Hourly Price Chart

Chart prepared by James Stanley; Nasdaq 100 on Tradingview
Dow Jones Continues Consolidation
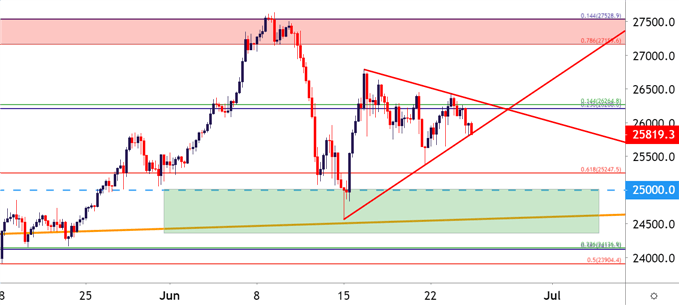
Meanwhile, the both the Dow and S&P have appeared to lag in that enthusiasm shown around the Nasdaq of recent. The Dow Jones Industrial Average has been in varying stages of mean reversion over the past couple of weeks, with no clear direction seen since the sell-off of a couple weeks ago, which increased in force just after the FOMC rate decision.
That sell-off found support at a key spot on the chart to open last week’s trade, and after a quick re-entrance from buyers prices have continue that consolidation, taking on the form of the symmetrical wedge looked at on the four-hour chart below.
Dow Jones Four-Hour Price Chart

Chart prepared by James Stanley; Dow Jones on Tradingview
The S&P 500 Also Consolidating
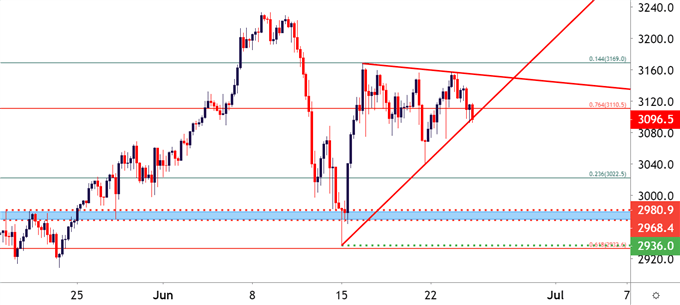
Similarly, the S&P 500 found support at a key zone on the chart ahead of last week’s open, and that helped to bring some buyers back into the mix after a quick but aggressive sell-off. And, since that quick bump, consolidation has been the name of the game as prices have put in both lower-highs and higher-lows.


The key areas of consideration here appear to be that support zone from a couple of weeks ago, spanning around the 3k level on the index; with resistance potential around 3110, 3150 and 3170.
S&P 500 Four-Hour Price Chart

Chart prepared by James Stanley; SPX500 on Tradingview
--- Written by James Stanley, Strategist for DailyFX.com
Contact and follow James on Twitter: @JStanleyFX


